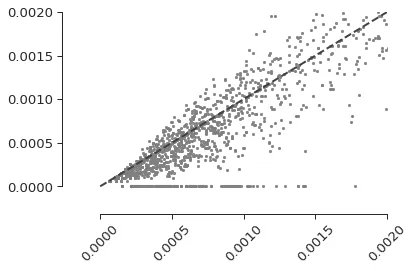
我正在使用matplotlib和seaborn生成一些图形,如下例所示,x轴和y轴的长度不同。
我的示例代码并不特别,但这里是一个示例:
我的示例代码并不特别,但这里是一个示例:
# plot data
plt.scatter(df['x'], df['y'], color = 'gray', s=5) # s controls point size
plt.xlim(-0.0002,0.002)
plt.ylim(-0.0002,0.002)

# add y=x line
plt.plot([0,1],[0,1], lw=2, color='#414242', linestyle='dashed')

sns.set_context("paper", font_scale=1.5)
plt.xlabel(xlabel, {'size':'20'})
plt.ylabel(ylabel, {'size':'20'})
plt.title(title)

sns.set_style('ticks')
sns.despine(offset=10, trim=True)
plt.xticks(rotation=45)
plt.tight_layout()
plt.show()
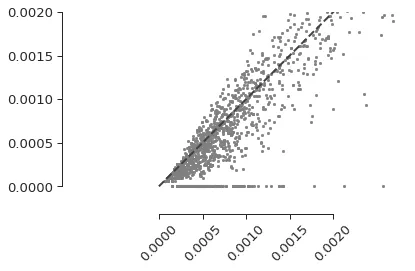
使用 plt.axis('equal'):
sns函数有什么用处?如果不使用它们,问题也会出现吗?) - ImportanceOfBeingErnest