我正在制作篮球投篮图表。我需要找出如何在背景中实际绘制篮球场的轮廓线。有什么想法吗?
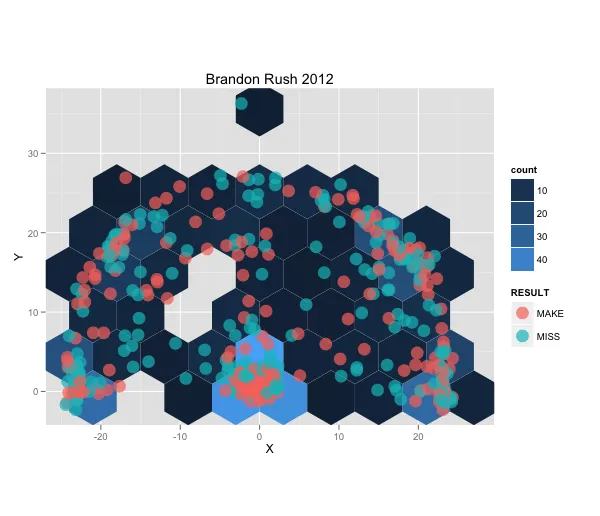
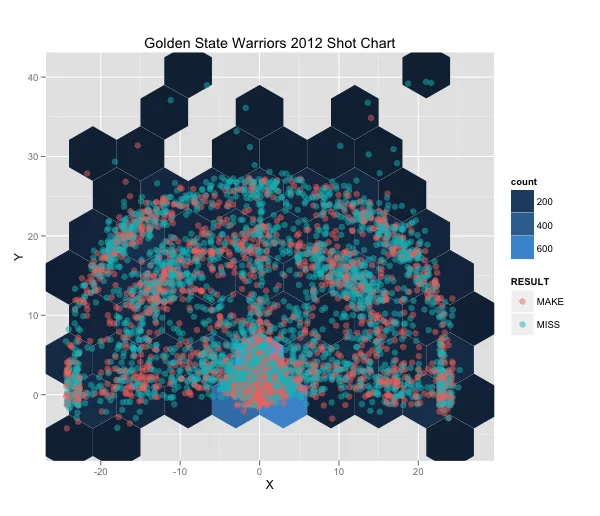
我正在制作篮球投篮图表。我需要找出如何在背景中实际绘制篮球场的轮廓线。有什么想法吗?
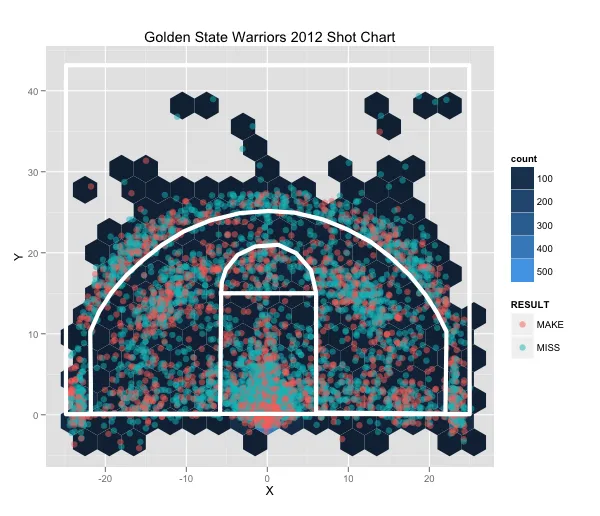
    ggplot(shots, aes(X,Y)) + stat_binhex(binwidth=c(3,3)) +
    geom_point(size=3, alpha=0.5, aes(color=RESULT), position="jitter") +
    coord_equal() + theme_grey() + opts(title="Golden State Warriors 2012 Shot Chart") +
    geom_path(data=ft_line, aes(x,y), colour="white", size=2) +
    geom_path(data=court, aes(x,y), colour="white", size=2)
geom_path 命令中的数据包含了白色球场图表的 (x,y) 坐标。
annotate_raster或类似的函数。 - mnel+ geom_path(data=<basketball_court_specs>)来实现一些功能。请查看 https://dev59.com/omHVa4cB1Zd3GeqPqMvz 以获取更多想法(将geom_polygon替换为geom_path)。 - naught101