我正在搜索,但仍然找不到一个非常简单的问题的答案 - 如何在R中使用ggplot2生成一个变量的简单点图?
使用plot命令非常简单:
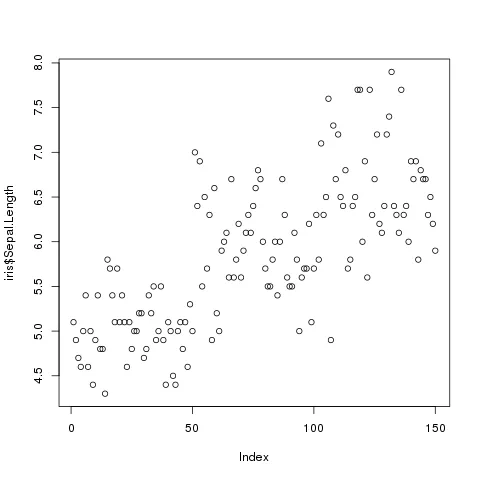
plot(iris$Sepal.Length, type='p')
但是,当我尝试将一个变量传递给qplot并指定geom="point"时,我出现了错误 "Error in UseMethod("scale_dimension")"。
如何使用ggplot2创建类似这样的图形?
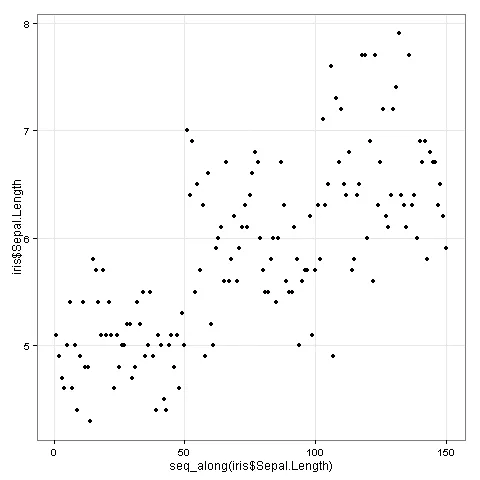
你可以使用seq_along手动创建索引向量。
library(ggplot2)

qplot(seq_along(iris$Sepal.Length), iris$Sepal.Length)
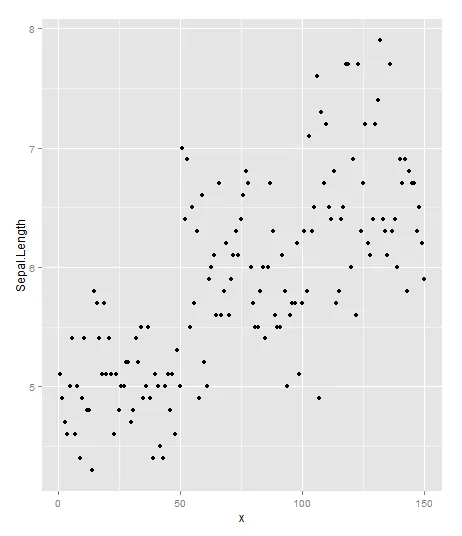
实际上,您不是在绘制一个变量,而是两个。 X变量是您的数据顺序。根据您的示例,您想要的答案是:
library(ggplot2)
ggplot(iris, aes(y = Sepal.Length, x = seq(1, length(iris$Sepal.Length)))) + geom_point()
回答您的问题会更接近于这样:
ggplot(iris, aes(x = Sepal.Length)) + geom_dotplot()
在不使用qplot并且不指定data参数的情况下,有一个替代方法:
ggplot(mapping=aes(x=seq_along(iris$Sepal.Length), y=iris$Sepal.Length)) +
    geom_point()
或者:
ggplot() +
    geom_point(aes(x=seq_along(iris$Sepal.Length), y=iris$Sepal.Length))
require(ggplot2)

x= seq(1,length(iris$Sepal.Length))
Sepal.Length= iris$Sepal.Length

data <- data.frame(x,Sepal.Length)

ggplot(data) + geom_point(aes(x=x,y=Sepal.Length))
library(ggplot2)
qplot(1:nrow(iris), Sepal.Length, data = iris, xlab = "Index")
或者
ggplot(data = iris, aes(x = 1:nrow(iris), y = Sepal.Length)) +
    geom_point() +
    labs(x = "Index")