如何将RGB图像的像素转换为L*a*b*?

8

我正在进行图像处理,以识别图像的颜色变化,并能够在直方图中绘制该数据。为此,我使用RGB颜色空间中的皮肤斑点图像。下面的代码可以获取每个像素的颜色并使用color.rgb2lab转换为HSV。但是,由于我想将其转换为L*a*b*,因为它更接近人类视觉,在Python库中没有转换为L*a*b*。因此,通过RGB的分离像素,如何将这些像素转换为LAB颜色?

import numpy as np
import mpl_toolkits.mplot3d.axes3d as p3
import matplotlib.pyplot as plt
import colorsys
from PIL import Image

# (1) Import the file to be analyzed!
img_file = Image.open("IMD006.png")
img = img_file.load()

# (2) Get image width & height in pixels
[xs, ys] = img_file.size
max_intensity = 100
hues = {}

# (3) Examine each pixel in the image file
for x in xrange(0, xs):
  for y in xrange(0, ys):
    # (4)  Get the RGB color of the pixel
    [r, g, b] = img[x, y]

# (5)  Normalize pixel color values
r /= 255.0
g /= 255.0
b /= 255.0

# (6)  Convert RGB color to HSV
[h, s, v] = colorsys.rgb_to_hsv(r, g, b)

# (7)  Marginalize s; count how many pixels have matching (h, v)
if h not in hues:
  hues[h] = {}
if v not in hues[h]:
  hues[h][v] = 1
else:
  if hues[h][v] < max_intensity:
    hues[h][v] += 1
3
如果我没记错的话,你需要进行两个步骤的转换,先从RGB转到XYZ,再从XYZ转到LAB。在进行XYZ转换时,你需要选择一个颜色空间。请注意,我的翻译是通俗易懂的,但并没有改变原意。 - user3483203
1
你可以使用以下模块进行RGB到L*A*B转换:
skimage http://scikit-image.org/docs/0.14.x/api/skimage.color.html#rgb2lab
或者opencv https://docs.opencv.org/3.4.3/d7/d1b/group__imgproc__misc.html#ga397ae87e1288a81d2363b61574eb8cab
- deadvoid
2
Poynton的颜色常见问题解答是如何将一个颜色空间转换为另一个颜色空间的最佳资源。它只会给你方程式,如果你在任何库中找不到它们,你就必须自己实现它们。 - Cris Luengo
3
OpenCV支持Lab*颜色空间转换:https://docs.opencv.org/3.4/de/d25/imgproc_color_conversions.html - Cris Luengo
但是在我发布的hsv示例中,它将每个颜色属性H S V分开,这种转换如何将值带到L A B?我是图像处理新手,我并不真正掌握这些工具。 - Tecnologia da Net
2
阅读Cris指向的颜色FAQ。它将帮助您聚焦于您的问题。(L*a*b仅在第35节中提到,但为了自己的利益,请从顶部开始阅读。) - Jongware
4个回答

12

您可以使用内置的色彩管理系统,并构建以下转换,使用PIL/Pillow来完成此操作:

#!/usr/local/bin/python3

import numpy as np
from PIL import Image, ImageCms

# Open image and discard alpha channel which makes wheel round rather than square
im = Image.open('colorwheel.png').convert('RGB')

# Convert to Lab colourspace
srgb_p = ImageCms.createProfile("sRGB")
lab_p  = ImageCms.createProfile("LAB")

rgb2lab = ImageCms.buildTransformFromOpenProfiles(srgb_p, lab_p, "RGB", "LAB")
Lab = ImageCms.applyTransform(im, rgb2lab)

现在,Lab 是以 Lab 色彩空间表示的图像。如果你继续并添加以下代码到上面的代码最后,你可以将 Lab 图像拆分为其组成通道,并将每个通道保存为灰度图像进行检查。

# Split into constituent channels so we can save 3 separate greyscales
L, a, b = Lab.split()

L.save('L.png')
a.save('a.png')
b.save('b.png')

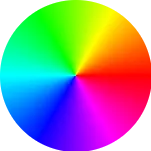
因此,如果您从这张图片开始:

enter image description here

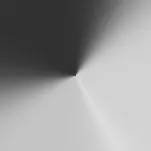
则会得到以下 L 通道图像:

enter image description here

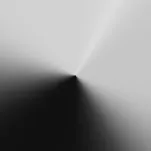
以下是 a 通道的图像:

enter image description here

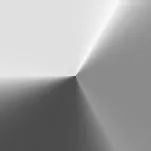
而这是 b 通道的图像:

enter image description here

非科学性地说,a 通道在图像呈绿色时应为负/低,并且在图像呈洋红色时应为高/正,以使其看起来正确。而 b 通道在图像为蓝色时应为负/低,在图像为黄色时应为高/正,所以对我来说看起来很不错!至于 L 通道,RGB 转灰度的公式是(凭记忆)类似于:

L = 0.2*R + 0.7*G + 0.1*B

因此,您会期望在图像为绿色的地方,L通道会更亮,并且在蓝色的地方最暗。


或者,您可以使用scikit-image模块进行操作,甚至可以更简单地执行如下操作:

import numpy as np
from skimage import color, io

# Open image and make Numpy arrays 'rgb' and 'Lab'
rgb = io.imread('image.png')
Lab = color.rgb2lab(rgb)

我不能百分之百确定缩放比例,但我怀疑L通道是0到100范围内的浮点数,ab也是在-128到+128范围内的浮点数,虽然我可能错了!

使用我上面的彩色轮图像,我得到了每个通道的以下最小值/最大值:

Lab[:,:,0].min()     # L min
32.29567256501352

Lab[:,:,0].max()     # L max
97.13950703971322

Lab[:,:,1].min()     # a min
-86.18302974439501

Lab[:,:,1].max()     # a max
98.23305386311316

Lab[:,:,2].min()     # b min
-107.85730020669489

Lab[:,:,2].max()     # b max
94.47812227647823

有没有一种方法可以为多个波段执行此操作?比如说,如果我们有RGB + 1个额外的波段/层,我们该如何处理呢? - Jaskaran Singh Puri
对于其他人在RGB->LAB->RGB实验中对LAB空间中的像素数据进行一些调整:skimage方法基本上可以直接使用,而ImageCms则更难实现。 - mvds

3
from colormath.color_objects import sRGBColor, LabColor
from colormath.color_conversions import convert_color 

def rgb_to_cielab(a):
    """
    a is a pixel with RGB coloring
    """
    a1,a2,a3 = a/255

    color1_rgb = sRGBColor(a1, a2, a3);

    color1_lab = convert_color(color1_rgb, LabColor);

    return color1_lab

rgb_to_cielab(np.array([255,0,255]))

输出:LabColor(lab_l=60.32364943499053,lab_a=98.23532017664644,lab_b=-60.83501679458592)


你如何将此应用于整个图像? - Ayaz49

2
使用cv2库,您可以轻松实现此转换。RGB->LAB,LAB->RGB。
import numpy as np
import cv2

img = cv2.imread('1.jpg')
LAB = cv2.cvtColor(img, cv2.COLOR_BGR2LAB)

cv2.imwrite('L.png', LAB[:,:,0])
cv2.imwrite('a.png', LAB[:,:,1])
cv2.imwrite('b.png', LAB[:,:,2])

BGR = cv2.cvtColor(LAB, cv2.COLOR_LAB2BGR)
# img = cv2.cvtColor(img, cv2.COLOR_BGR2RGB)
cv2.imwrite('new.png', BGR)

1
为了提高答案的质量,请提供一些上下文。否则,它将成为机器标记为“低质量答案”的食物。 - ZF007
谢谢,我会添加一些指示。 - nachifur

1

我也遇到了和你一样的问题已经有三个月了,这是我的解决方案

import numpy as np
import mpl_toolkits.mplot3d.axes3d as p3
import matplotlib.pyplot as plt
import colorsys
from PIL import Image
from past.builtins import xrange
img_file = Image.open("F:/coding/Project/FDD/neo5.png")
img = img_file.load()
[xs, ys] = img_file.size
max_intensity = 100
hues = {}
for x in xrange(0, xs):
   for y in xrange(0, ys):

[r, g, b] = img[x, y]
r /= 255.0
g /= 255.0
b /= 255.0
[h, s, v] = colorsys.rgb_to_hsv(r, g, b)
if h not in hues:
   hues[h] = {}
if v not in hues[h]:
   hues[h][v] = 1
else:
   if hues[h][v] < max_intensity:
      hues[h][v] += 1
h_ = []
v_ = []
i = []
colours = []
for h in hues:
   for v in hues[h]:
      h_.append(h)
      v_.append(v)
      i.append(hues[h][v])
      [r, g, b] = colorsys.hsv_to_rgb(h, 1, v)
      colours.append([r, g, b])

fig = plt.figure()
ax = p3.Axes3D(fig)
ax.scatter(h_, v_, i, s=5, c=colours, lw=0)
ax.set_xlabel('Hue')
ax.set_ylabel('Value')
ax.set_zlabel('Intensity')
fig.add_axes(ax)
plt.show()

网页内容由stack overflow 提供, 点击上面的
可以查看英文原文,
原文链接