我需要确定一个光源发出的光谱(分光仪)。为了做到这一点,我需要将每个像素转换为波长。
为了解决RGB值没有单一值的问题,我将使用棱镜来获得光学格子。这样,我就可以接收到光谱的部署,而光谱的差异仅沿X轴。
我的问题是,如何将像素转换为波长,并以波长的强度作为函数获得图形。
为了解决RGB值没有单一值的问题,我将使用棱镜来获得光学格子。这样,我就可以接收到光谱的部署,而光谱的差异仅沿X轴。
我的问题是,如何将像素转换为波长,并以波长的强度作为函数获得图形。
You have to get wavelength from x position
You can not compute wavelength from color as the two are not the same thing. So first you should calibrate your spectroscope with known wavelengths. From that infer function:
wavelength = f(x)
either by LUT and interpolation, or by approximation polynomial. For more info see:
You can use Sun light as a reference and calibrate based on the known spectral (Fraunhofer) lines. Here first example I found on google:
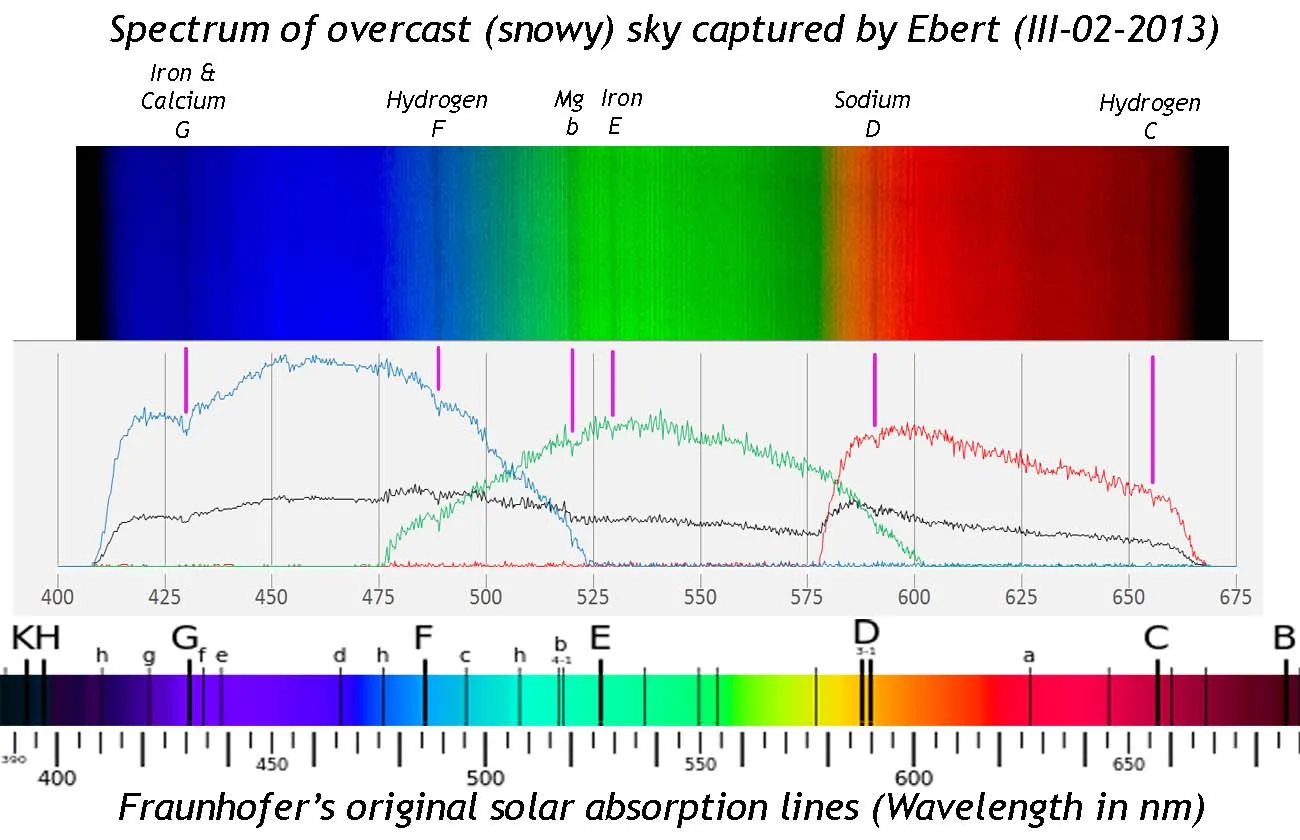
So take/plot a sunlight shot here mine:
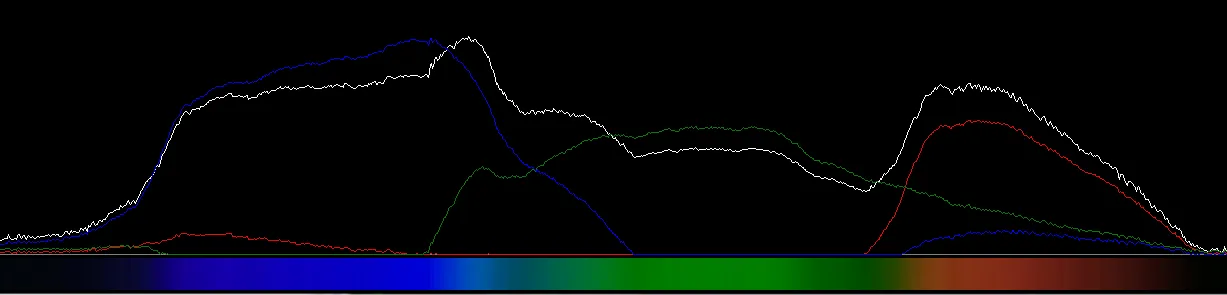
cross match the Fraunhofer lines (the darker lines, beware of over exponated images they can screw things up, also the Intensity is R+G+B without weight we do not want human perception like conversion) and make a table of Known wavelengths x positions in your image. From that interpolate your wavelength = f(x).
As you can see my shot of Sun's spectra more or less matches the reference one (discrepances are due to grating material, bayer filter, camera properties, clouds and atmosphere,etc...). How ever the Fraunhofer lines are not easily detectable by local minima so may be some user assistance GUI style will be a better idea to start with.
But beware that most spectra images on the WEB is wrong or nonlinear or shifted !!! So to be sure I created a reference spectra from linearized spectral data like this and here the result 400-700 [nm]:

And here the plot:
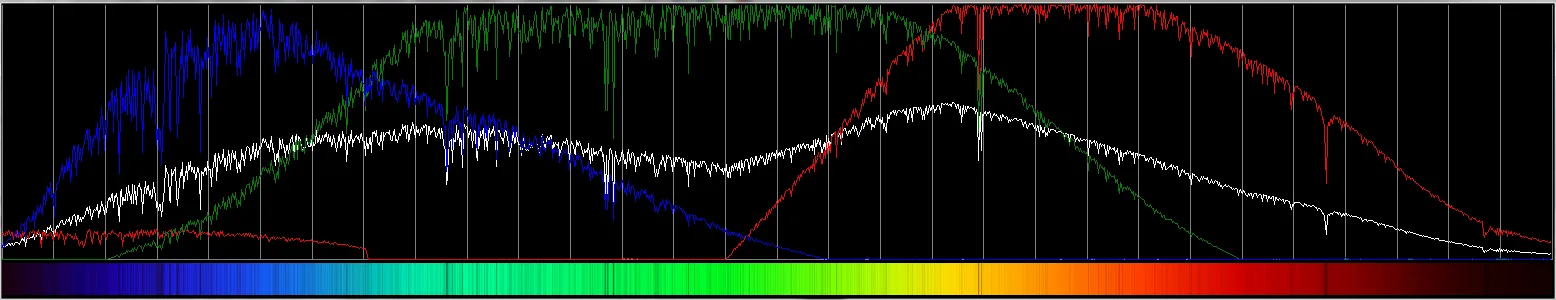
the gray lines are grid from 400-700 nm with 10 nm step.
Here is how your setup should look like:
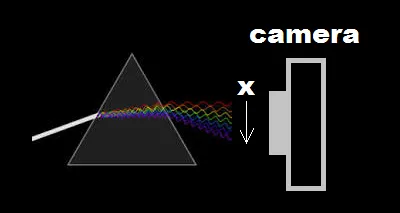
Here is image from mine spectro-scope (looking at White area on my LCD):

I am using grating grid made from DVD hence the circular arc shapes. Now if your camera is in fixed position relative to your prism then for selected horizontal line the x position of pixel directly corresponds to a specific wavelength.
If you do not see any Fraunhofer lines then you are missing aperture before the prism/grating. I usually use 2 razor blades distanced by 0.1 mm set by thin paper. If your image is out of focus you need to add lens(es) before your camera/sensor and or add more shielding from outside light.
As I mentioned before You cannot get wavelength from color because there is "infinite" combinations of input spectra creating the same RGB response. For example take white color ... it can be composed form 3 or more distinct wavelengths or even continuous white noise. So from RGB you can not tell which one it is... If you add also the x positon with combination of prism/grating then you can get the wavelength but it would be much more complicated and less precise then direct conversion from just x position...
compute intensity from RGB
this may be a bit tricky as your sensor may have different sensitivity for different wavelengths. You can normalize intensity similarly to #1. Just take shot of known intensity light source and approximate for the missing wavelengths. Also this can be done with Sunlight as a source
From normalized color you just compute gray-scale intensity and that is it.
To improve accuracy you can average all the pixels for the same x.
Also to boost accuracy and sensitivity usually non color sensor is used (mostly linear cameras) either by design or by removing the Bayer filter so it does not mess up the data.
plot the data
on x axis is the wavelength and on y axis is the intensity. If you want to apply spectral colors you can use this:
发射带宽越窄,越好。激光适用于此类要求,但也请注意功率,并确保不超过您的图像传感器限制。最好使用三种波长(红色、绿色、蓝色)校准测量系统。理想情况下,当使用红色激光时,读取原始图像并查看像素的绿色和蓝色通道上是否存在任何电荷积累。(因为每个像素都有贝尔滤波器模式)。如果积累过高,请考虑使用高质量的图像传感器。然后,按照Noel Segura Meraz建议的HSV方法进行操作。对您拍摄的图像使用垂直合并。垂直合并是指简单地将传感器阵列中一列的强度值相加。一旦您使用这三种激光校准了系统,请混合和匹配它们以验证您的插值函数是否有效。
rgb2hsv来完成此操作。Hue = (650 - wavelength)*240/(650-475)
更多关于此的信息在这里
但这只在理想光照条件下并且您的相机足够灵敏且其CCD具有真正的绿色,红色和蓝色时才能起作用,我不知道如何测试。更不用说您在显示器中看到的波长也取决于显示器的校准,所以我不会信任它。
您可以通过'S'或'saturation'的值来检查每个像素的纯度和理想程度。值越高,效果越好。
我建议您手动校准它。查看您的光谱,并使用铅笔或其他东西标记您知道其波长的颜色的位置,然后使用这些标记来定义图表的x轴。
我忘了提到,你只需要进行一次校准,一旦你知道相机中哪个波长对应哪个色调,你就可以自动进行设置,甚至使用scatter(hue_wavelenght,value)可能也可以。
我建议先尝试反转this code,因为它实际上是与你所需要的相反的。而最终的部分(% LET THE INTENSITY SSS FALL OFF NEAR THE VISION LIMITS)对于你的案例来说没有什么关联性,它只是试图重新创建人类感知。
如果你真的想要一个准确运行的系统,你需要建立某种校准流程。大多数摄像头并不是非常准确,而且行为会随着温度等因素的改变而变化,因此必须重复操作。
你是否也考虑过使用位置来识别波长呢?当一切都设置在固定位置时,你可以计算出每种波长在表面上的位置。剩下的工作就是建立某种校准映射,将像素与波长相关联,需要付出一些努力,但一旦你将所有东西设置在固定位置,这是一次性的校准。另一个优点是,一旦你把比例尺写在表面上,你就有了一种简单的方式来记录和验证传感数据。