iOS Charts 3.0 - 如何将x轴标签(日期)与数据对齐

14

我正在尝试将库Charts(来自Daniel Gindi)从版本2(Swift 2.3)迁移到版本3(Swift 3),但遇到了困难。

基本上,我无法正确地对齐x轴标签(日期)与相应的绘图。
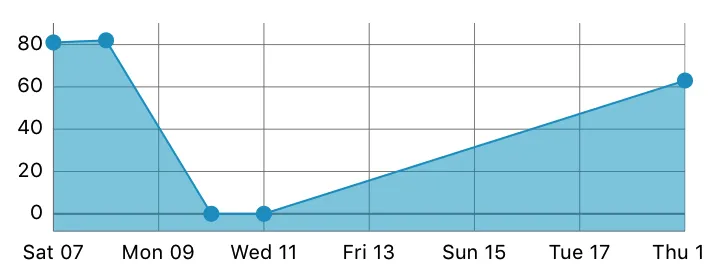
这是我在版本2中曾经有过的:

在版本2中,我有7、8、10和11天的值。 因此,在中间缺少一天,但标签与绘图正确对齐。
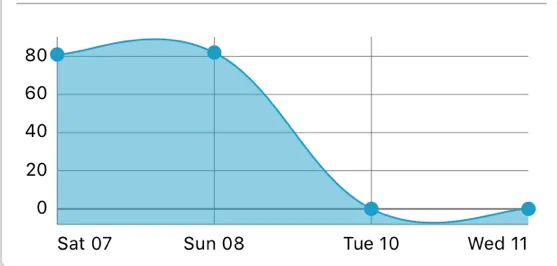
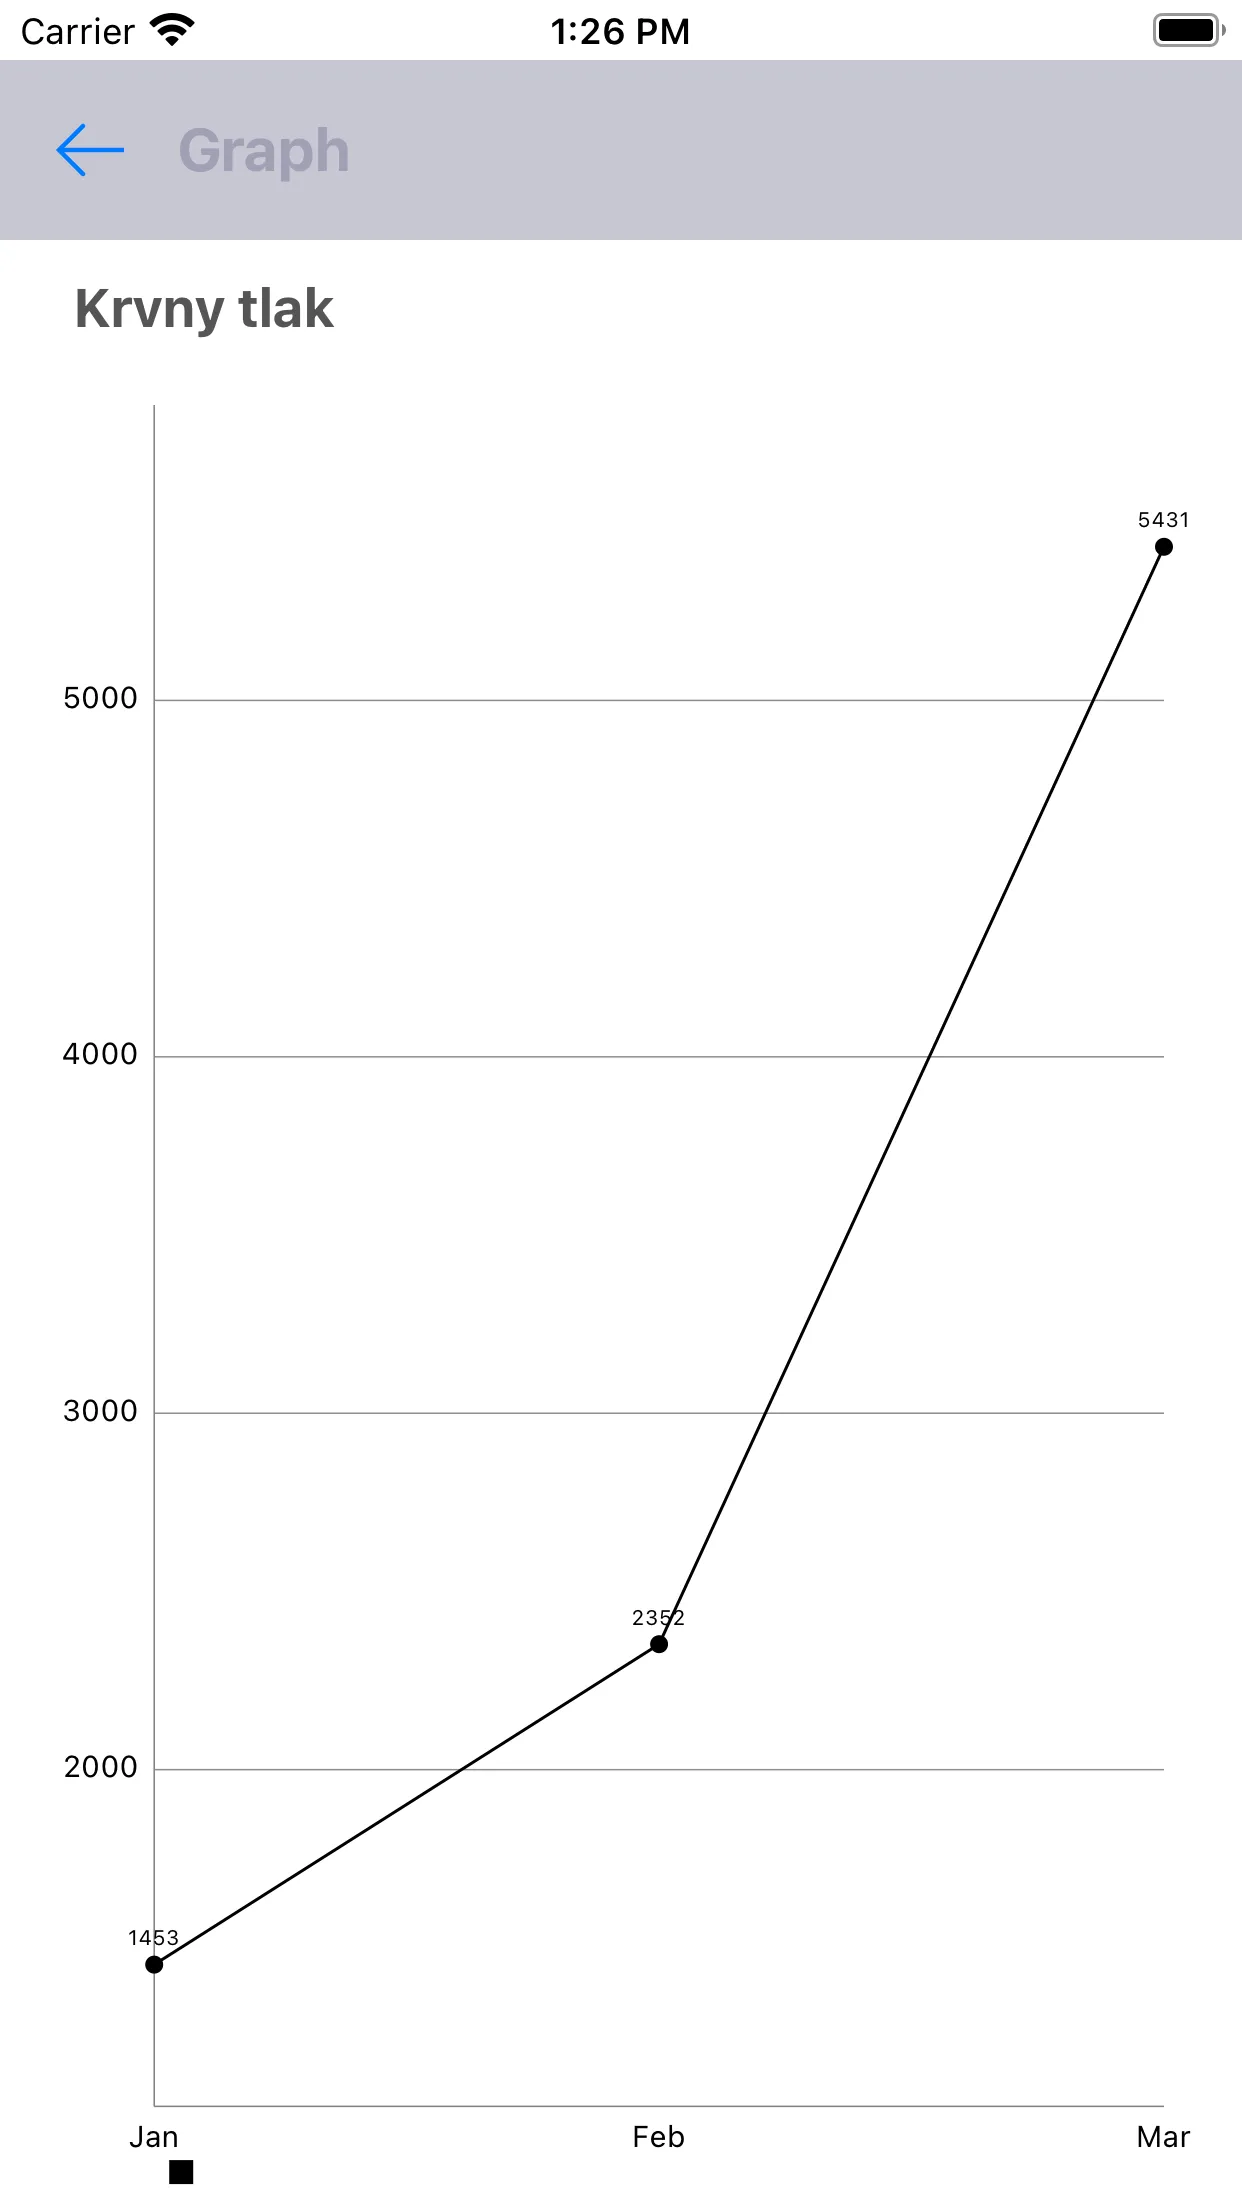
 Charts 2


这是我在版本3中拥有的:

在版本3中,“x轴标签”现在已被双倍替换(用于日期,它是自1970年以来的时间间隔),并通过格式化程序进行格式化。 因此,毋庸置疑,现在图表更加“正确”,因为图表正确地外推了第9个值,但我找不到如何将标签放在相应的绘图下面。 Charts 3

这是我的x轴代码:

 let chartView = LineChartView()
 ...
 let xAxis = chartView.xAxis
 xAxis.labelPosition = .bottom
 xAxis.labelCount = entries.count
 xAxis.drawLabelsEnabled = true
 xAxis.drawLimitLinesBehindDataEnabled = true
 xAxis.avoidFirstLastClippingEnabled = true

 // Set the x values date formatter
 let xValuesNumberFormatter = ChartXAxisFormatter()
 xValuesNumberFormatter.dateFormatter = dayNumberAndShortNameFormatter // e.g. "wed 26"
 xAxis.valueFormatter = xValuesNumberFormatter

这是我创建的ChartXAxisFormatter类:

import Foundation
import Charts

class ChartXAxisFormatter: NSObject {
    var dateFormatter: DateFormatter?
}

extension ChartXAxisFormatter: IAxisValueFormatter {

    func stringForValue(_ value: Double, axis: AxisBase?) -> String {
        if let dateFormatter = dateFormatter {

            let date = Date(timeIntervalSince1970: value)
            return dateFormatter.string(from: date)
        }

        return ""
    }

}

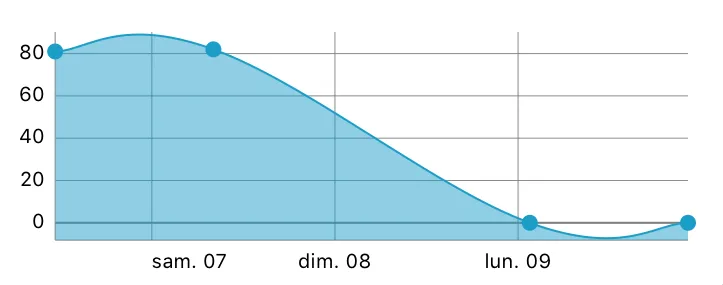
所以,这里的数值是正确的,格式也正确,图表的形状也正确,但标签与相应绘图的对齐不好。

感谢你的帮助


我能够复制使用 Charts 3.0.0 和 Charts 3.0.1 的问题。同时,我在另一个项目中使用 Charts 3.0.0 的代码没有遇到这些问题。也许是某些图表设置的组合导致了这个错误? - Alex
我在Charts Github仓库中得到了一个回复:显然,当在x轴上使用时间间隔时会出现这种情况,因为Charts使用插值来确定要显示哪些标签。 - Frederic Adda
1
错位的原因是:xAxis.avoidFirstLastClippingEnabled = true - Jojo Narte
4个回答

29

好的,明白了!

您需要定义一个参考时间间隔(即x轴上的“0”),然后计算每个x值的附加时间间隔。

ChartXAxisFormatter变为:

import Foundation
import Charts

class ChartXAxisFormatter: NSObject {
    fileprivate var dateFormatter: DateFormatter?
    fileprivate var referenceTimeInterval: TimeInterval?

    convenience init(referenceTimeInterval: TimeInterval, dateFormatter: DateFormatter) {
        self.init()
        self.referenceTimeInterval = referenceTimeInterval
        self.dateFormatter = dateFormatter
    }
}


extension ChartXAxisFormatter: IAxisValueFormatter {

    func stringForValue(_ value: Double, axis: AxisBase?) -> String {
        guard let dateFormatter = dateFormatter,
        let referenceTimeInterval = referenceTimeInterval
        else {
            return ""
        }

        let date = Date(timeIntervalSince1970: value * 3600 * 24 + referenceTimeInterval)
        return dateFormatter.string(from: date)
    }

}

然后,当我创建我的数据条目时,它的工作方式如下:

// (objects is defined as an array of struct with date and value)

// Define the reference time interval
var referenceTimeInterval: TimeInterval = 0
if let minTimeInterval = (objects.map { $0.date.timeIntervalSince1970 }).min() {
        referenceTimeInterval = minTimeInterval
    }


    // Define chart xValues formatter
    let formatter = DateFormatter()
    formatter.dateStyle = .short
    formatter.timeStyle = .none
    formatter.locale = Locale.current

    let xValuesNumberFormatter = ChartXAxisFormatter(referenceTimeInterval: referenceTimeInterval, dateFormatter: formatter)


    // Define chart entries
    var entries = [ChartDataEntry]()
    for object in objects {
        let timeInterval = object.date.timeIntervalSince1970
        let xValue = (timeInterval - referenceTimeInterval) / (3600 * 24)

        let yValue = object.value
        let entry = ChartDataEntry(x: xValue, y: yValue)
        entries.append(entry)
    }

// Pass these entries and the formatter to the Chart ...

结果更好看(顺便说一下,我去掉了cubic): 输入图像的描述


我认为这就是我所做的。 - Frederic Adda
1
什么是xValuesFormatter? - shoujo_sm
我仍然无法解决这个问题。你能否请清楚地解释一下?谢谢。 - Manish Mahajan
3
@FrédéricAdda的回答中有几点需要补充说明:(1)我认为您想将formatter传递给xValuesNumberFormatter而不是xValuesFormatter。(2)虽然代码没有显示,但是需要在图表上设置xValuesNumberFormatter...换句话说:yourChartView.xAxis.valueFormatter = xValuesNumberFormatter - GarySabo
@GarySabo,你能否在我的链接上提供一些建议? - Matrosov Oleksandr
我也不知道如何配置这个。xValuesFormatter是什么? - Matrosov Oleksandr

5
如果您确切知道需要在x轴上显示多少个标签,可以使用以下代码解决。例如,如果我需要在x轴上显示七个标签,则这应该足够了。原因是图表库没有正确计算两个x轴点之间的间隔,因此导致了绘制标签不匹配的问题。当我们强制库根据给定数量的标签绘制时,问题似乎已经解决了。
 let xAxis = chart.xAxis
 xAxis.centerAxisLabelsEnabled = false
 xAxis.setLabelCount(7, force: true) //enter the number of labels here

3

enter image description here

@IBOutlet weak var tView:UIView!
@IBOutlet weak var lineChartView:LineChartView!{
    didSet{
        lineChartView.xAxis.labelPosition = .bottom
        lineChartView.xAxis.granularityEnabled = true
        lineChartView.xAxis.granularity = 1.0

        let xAxis = lineChartView.xAxis
        //            xAxis.axisMinimum = 0.0
        //            xAxis.granularity = 1.0
        //            xaAxis.setLabelCount(6, force: true)
    }
}

@IBOutlet weak var back: UIButton?
@IBAction func back(_ sender: Any) {
    self.navigationController?.popViewController(animated: true)
}

override func viewDidLoad() {
    super.viewDidLoad()

    self.lineChartView.delegate = self
    self.lineChartView.chartDescription?.textColor = UIColor.white

    let months = ["Jan" , "Feb", "Mar"]
    let dollars1 = [1453.0,2352,5431]
    setChart(months, values: dollars1)
}

func setChart(_ dataPoints: [String], values: [Double]) {

    var dataEntries: [ChartDataEntry] = []

    for i in 0 ..< dataPoints.count {
        dataEntries.append(ChartDataEntry(x: Double(i), y: values[i]))
    }

    let lineChartDataSet = LineChartDataSet(entries: dataEntries, label: nil)
    lineChartDataSet.axisDependency = .left
    lineChartDataSet.setColor(UIColor.black)
    lineChartDataSet.setCircleColor(UIColor.black) // our circle will be dark red
    lineChartDataSet.lineWidth = 1.0
    lineChartDataSet.circleRadius = 3.0 // the radius of the node circle
    lineChartDataSet.fillAlpha = 1
    lineChartDataSet.fillColor = UIColor.black
    lineChartDataSet.highlightColor = UIColor.white
    lineChartDataSet.drawCircleHoleEnabled = true

    var dataSets = [LineChartDataSet]()
    dataSets.append(lineChartDataSet)


    let lineChartData = LineChartData(dataSets: dataSets)
    lineChartView.data = lineChartData
    lineChartView.rightAxis.enabled = false
    lineChartView.xAxis.drawGridLinesEnabled = false
    lineChartView.xAxis.labelPosition = .bottom
    lineChartView.xAxis.valueFormatter = IndexAxisValueFormatter(values: dataPoints)
}


func chartValueSelected(_ chartView: ChartViewBase, entry: ChartDataEntry, highlight: Highlight) {
    print(entry)
}

为什么有两个“Jan”?这段代码有bug吗? - Sylar
1
我已经更新了答案并修复了错误。 - Faiz Ul Hassan

0

我使用了这个答案来解决这个问题 https://dev59.com/jFcP5IYBdhLWcg3wVok6#44554613

我怀疑这些偏移量是由于在我的情况下将 X 轴值调整到特定时间导致的

这是我的代码

for i in 0..<valuesViewModel.entries.count {
  let dataEntry = ChartDataEntry(x: roundDate(date: valuesViewModel.entries[i].date).timeIntervalSince1970, y: valuesViewModel.entries[i].value)
  dataEntries.append(dataEntry)
}


func roundDate(date: Date) -> Date {
  var comp: DateComponents = Calendar.current.dateComponents([.year, .month, .day], from: date)
  comp.timeZone = TimeZone(abbreviation: "UTC")!
  let truncated = Calendar.current.date(from: comp)!
  return truncated
}

网页内容由stack overflow 提供, 点击上面的
可以查看英文原文,
原文链接