使用Python中的Keras神经网络的特征重要性图表

48

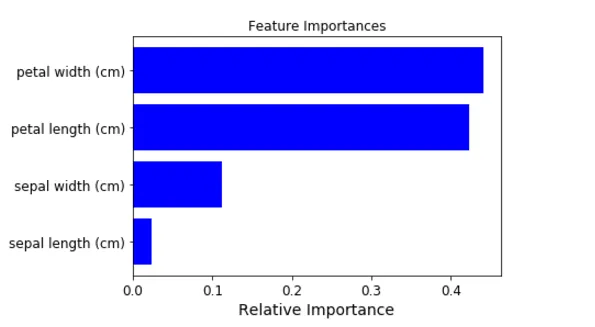
我正在使用Python(3.6) Anaconda (64位) Spyder (3.1.2)。我已经使用Keras (2.0.6)为回归问题(一个响应变量,10个自变量)设置了神经网络模型。我想知道如何生成类似于下图的特征重要性图表:

feature importance chart

def base_model():
    model = Sequential()
    model.add(Dense(200, input_dim=10, kernel_initializer='normal', activation='relu'))
    model.add(Dense(1, kernel_initializer='normal'))
    model.compile(loss='mean_squared_error', optimizer = 'adam')
    return model

clf = KerasRegressor(build_fn=base_model, epochs=100, batch_size=5,verbose=0)
clf.fit(X_train,Y_train)
4个回答

39

我最近在寻找答案,发现了一个对我的工作有帮助的东西,并认为分享这个会很有帮助。我最终使用了排列重要性模块,该模块来自eli5 package。它最容易与scikit-learn模型配合使用。幸运的是,Keras提供了一个顺序模型的包装器。如下所示,使用它非常简单。

from keras.wrappers.scikit_learn import KerasClassifier, KerasRegressor
import eli5
from eli5.sklearn import PermutationImportance

def base_model():
    model = Sequential()        
    ...
    return model

X = ...
y = ...

my_model = KerasRegressor(build_fn=base_model, **sk_params)    
my_model.fit(X,y)

perm = PermutationImportance(my_model, random_state=1).fit(X,y)
eli5.show_weights(perm, feature_names = X.columns.tolist())

追踪(Traceback)(最近的调用在最后):文件(File)<module> eli5.show_weights(perm,feature_names = col)属性错误(AttributeError):模块'eli5'没有'show_weights'属性。 - S34N
不确定问题出在哪里。它在我的电脑上可以运行,并且在这里的文档中有列出:https://eli5.readthedocs.io/en/latest/overview.html 你是否拥有最新版本? - Justin Hallas
eli5.show_weights 输出一个 HTML 对象,因此它只能在 iPython(jupyter)Notebook 中显示。 - gradLife
2
为什么所有排列的总和(perm.feature_importances_)不等于一? - Henry Navarro
我想补充一点,eli5 目前仅支持 2D 数组。如果您的模型使用了像 GRULSTM 这样的 3D 层,那么 eli5 将无法为您工作。您需要使用另一个库,例如 SHAP - user5305519
显示剩余2条评论

19

这是一个比较古老的帖子,其中包含了一些相对陈旧的回答。因此,我想提供另一个使用SHAP来确定您的Keras模型特征重要性的建议。与eli5当前仅支持2D数组不同,SHAP支持2D和3D数组(因此,如果您的模型使用需要3D输入的层如LSTMGRU,则eli5将无法工作)。

下面是一个示例链接,展示了如何使用SHAP来绘制您的Keras模型特征的重要性。但是,如果该链接无法访问,我们也提供了一些示例代码和图表(取自上述链接):


import shap

# load your data here, e.g. X and y
# create and fit your model here

# load JS visualization code to notebook
shap.initjs()

# explain the model's predictions using SHAP
# (same syntax works for LightGBM, CatBoost, scikit-learn and spark models)
explainer = shap.TreeExplainer(model)
shap_values = explainer.shap_values(X)

# visualize the first prediction's explanation (use matplotlib=True to avoid Javascript)
shap.force_plot(explainer.expected_value, shap_values[0,:], X.iloc[0,:])

shap.summary_plot(shap_values, X, plot_type="bar")

输入图片描述


4
使用DeepExplainer时出现错误:keras不再支持,请改用tf.keras。 - Kermit
8
дҪҝз”ЁTreeExplainerж—¶еҮәй”ҷгҖӮ SHAPError: жЁЎеһӢзұ»еһӢиҝҳжңӘиў«TreeExplainerж”ҜжҢҒпјҡ<class 'tensorflow.python.keras.engine.sequential.Sequential'>гҖӮ - Kermit
@HashRocketSyntax 我猜你正在尝试使用Keras的Sequential层。你可以尝试使用这个导入语句来导入Sequential吗?from tensorflow.keras import Sequential - user5305519
3
@jarrettyeo,from tensorflow.keras import Sequential 仍然无法运行。我得到了错误:Exception: Model type not yet supported by TreeExplainer: <class 'tensorflow.python.keras.engine.sequential.Sequential'> - Mitch
@user5305519,你能提供以上任何问题的解决方案吗?我也遇到了这个错误:异常:TreeExplainer尚不支持模型类型:<class 'tensorflow.python.keras.engine.functional.Functional'>。 - 傅能杰
@Kermit 参考 https://dev59.com/e8Tra4cB1Zd3GeqP-Ijo#72480697 - seth

7

为什么不使用sklearn_RandomForest进行特征重要性分析呢? - JeeyCi

2
一个笨拙的方法是为每个神经元在每一层中获取权重,并将它们展示/堆叠在一起。
feature_df = pd.DataFrame(columns=['feature','layer','neuron','weight','abs_weight'])

for i,layer in enumerate(model.layers[:-1]): 
    w = layer.get_weights()
    w = np.array(w[0])
    n = 0
    for neuron in w.T:
        for f,name in zip(neuron,X.columns):
            feature_df.loc[len(feature_df)] = [name,i,n,f,abs(f)]
        
        n+=1
        
feature_df = feature_df.sort_values(by=['abs_weight'])
feature_df.reset_index(inplace=True)
feature_df = feature_df.drop(['index'], axis=1)

fig = px.bar(feature_df,x='feature',y='abs_weight',template='simple_white')
fig.show()

它会得到类似这样的结果,x轴是您的特征:

enter image description here


网页内容由stack overflow 提供, 点击上面的
可以查看英文原文,
原文链接