我们可以使用numpy计算噪声,使用matplotlib绘制结果。
import numpy as np
import matplotlib.pyplot as plt

def plot_spectrum(s):
    f = np.fft.rfftfreq(len(s))
    return plt.loglog(f, np.abs(np.fft.rfft(s)))[0]
这是Python装饰器的一个很好的使用案例。
def noise_psd(N, psd = lambda f: 1):
X_white = np.fft.rfft(np.random.randn(N));
S = psd(np.fft.rfftfreq(N))
S = S / np.sqrt(np.mean(S**2))
X_shaped = X_white * S;
return np.fft.irfft(X_shaped);
def PSDGenerator(f):
return lambda N: noise_psd(N, f)
@PSDGenerator
def white_noise(f):
return 1;
@PSDGenerator
def blue_noise(f):
return np.sqrt(f);
@PSDGenerator
def violet_noise(f):
return f;
@PSDGenerator
def brownian_noise(f):
return 1/np.where(f == 0, float('inf'), f)
@PSDGenerator
def pink_noise(f):
return 1/np.where(f == 0, float('inf'), np.sqrt(f))
PSDGenrator函数接受一个函数作为输入,并返回另一个函数,该函数将生成一个具有与给定函数相应的功率谱形状的随机信号。
行S = S / np.sqrt(np.mean(S**2))确保有色噪声将保留白噪声的能量。
让我们测试一下。
plt.style.use('dark_background')
plt.figure(figsize=(12, 8), tight_layout=True)
for G, c in zip(
[brownian_noise, pink_noise, white_noise, blue_noise, violet_noise],
['brown', 'hotpink', 'white', 'blue', 'violet']):
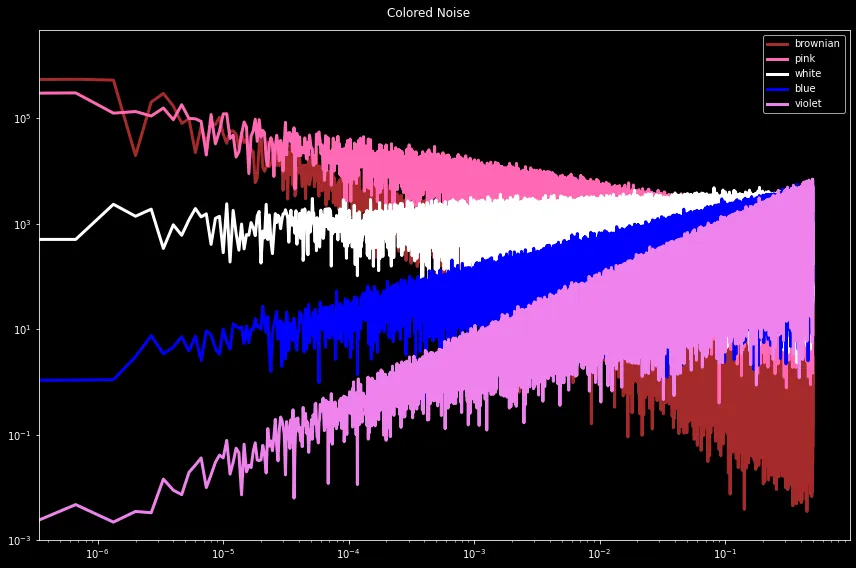
plot_spectrum(G(30*50_000)).set(color=c, linewidth=3)
plt.legend(['brownian', 'pink', 'white', 'blue', 'violet'])
plt.suptitle("Colored Noise");
plt.ylim([1e-3, None]);