我想创建一个ggplot2图,手动指定y-lab和注释文本。如果y-lab/注释文本太长,我希望用较短的文本替换它。由于我需要对大量的图进行操作,所以需要自动完成此操作。
考虑以下示例数据和文本:
现在,我可以按如下方式创建和导出ggplot:
考虑以下示例数据和文本:
# Create example data
set.seed(123)
data <- data.frame(x = rnorm(100),
                   y = rnorm(100))

# Create two text versions
text_long <- "This is a very long text which might exceed the plot limits"
text_short <- "Short text"
现在,我可以按如下方式创建和导出ggplot:
# Load ggplot2 package
library("ggplot2")
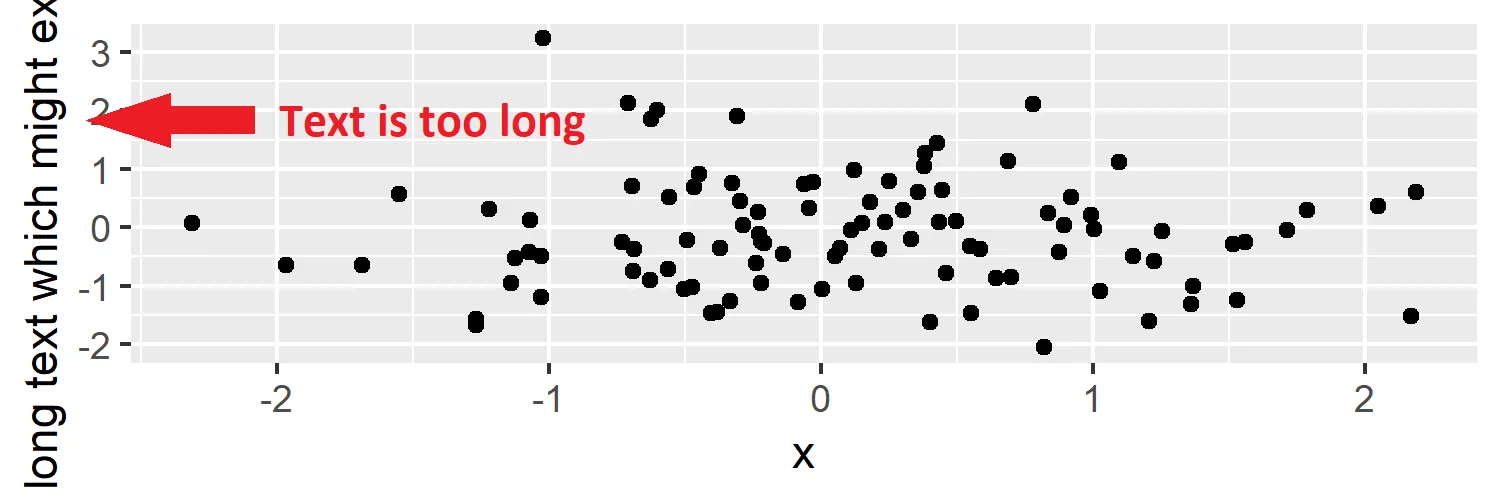
# Create first plot
ggp1a <- ggplot(data, aes(x = x, y = y)) +
geom_point() +
ylab(text_long)
# Export first plot as png
png("C:/Your-Path/my_plot1a.png", res = 300, height = 500, width = 1500)
ggp1a
dev.off()
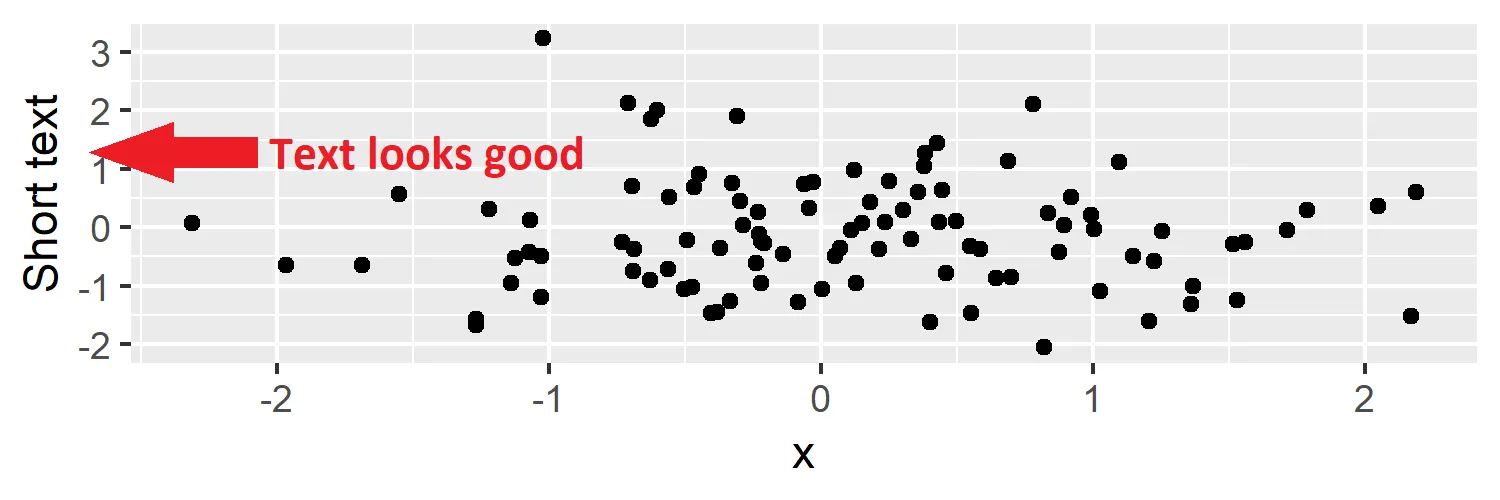
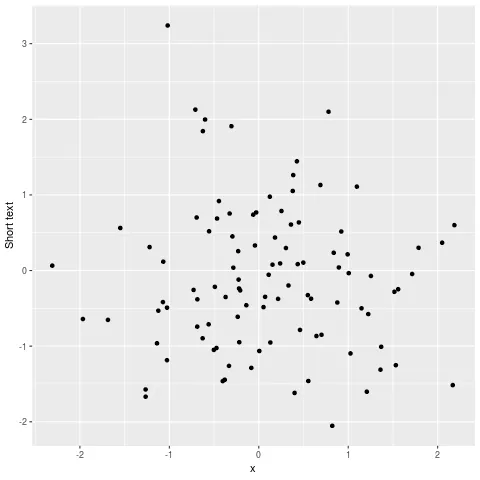
# Create second plot
ggp2a <- ggplot(data, aes(x = x, y = y)) +
  geom_point() +
  ylab(text_short) # Short text

# Export second plot as png
png("C:/Your-Path/my_plot2a.png", res = 300, height = 500, width = 1500)
ggp2a
dev.off()
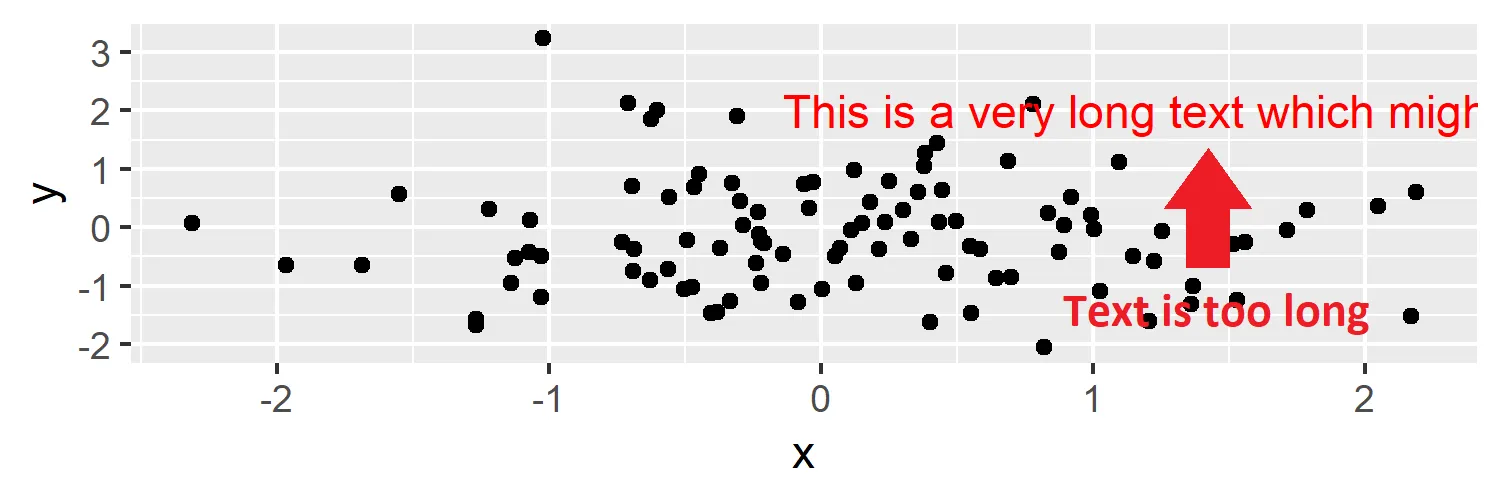
当我在绘图窗口中注释文本时,同样的问题会发生:
# Create first plot
ggp1b <- ggplot(data, aes(x = x, y = y)) +
  geom_point() +
  annotate("text", x = 2, y = 2, col = 2, label = text_long)

# Export first plot as png
png("C:/Your-Path/my_plot1b.png", res = 300, height = 500, width = 1500)
ggp1b
dev.off()
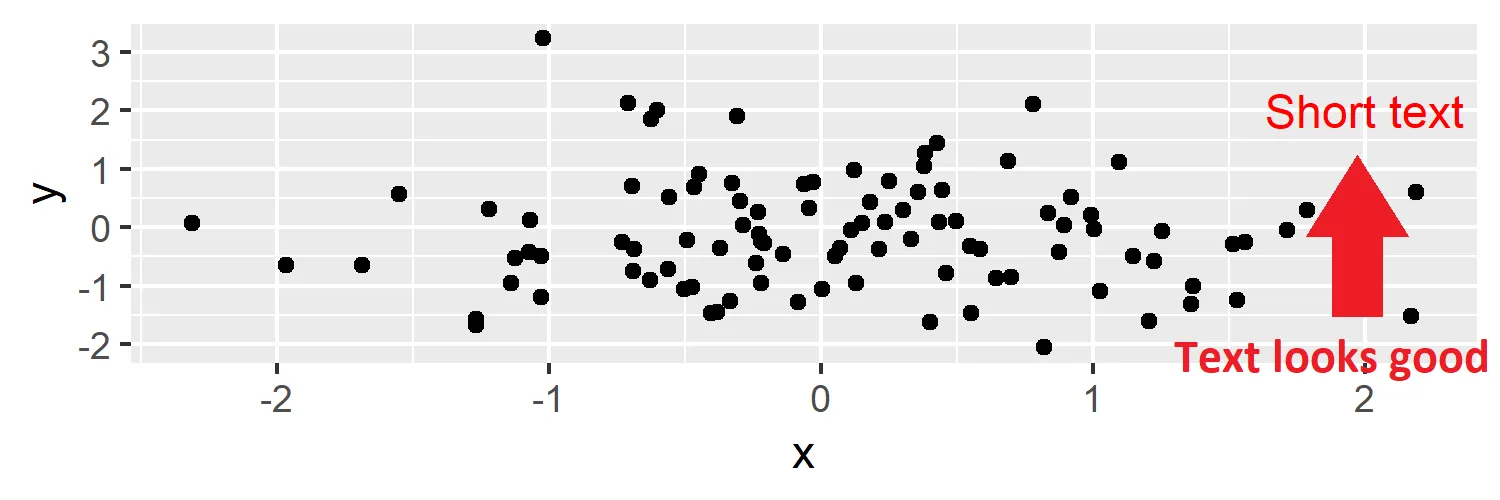
与之前相同的程序。如果文本被截断,我想将文本替换为以下内容:
# Create second plot
ggp2b <- ggplot(data, aes(x = x, y = y)) +
  geom_point() +
  annotate("text", x = 2, y = 2, col = 2, label = text_short) # Short text

# Export second plot as png
png("C:/Your-Path/my_plot2b.png", res = 300, height = 500, width = 1500)
ggp2b
dev.off()
str_length(ggp1a$labs$y))。然后,您可以构建一个带有if else语句的函数来实现。虽然这种方法可能只适用于y标签。 - Ben G