I have a data frame like this:
ORD   exp type         mu
1   Combi pH=7 exp_F   mu 0.15637365
2   Combi pH=7 exp_F   mu 0.12817901
3   Combi pH=7 exp_F   mu 0.13392221
4   Combi pH=7 exp_F   mu 0.09683254
5   Combi pH=7 exp_F   mu 0.11249738
6   Combi pH=7 exp_F   mu 0.10878719
7   Combi pH=7 exp_F   mu 0.11019295
8   Combi pH=7 exp_F   mu 0.12100511
9   Combi pH=7 exp_F   mu 0.09803942
10  Combi pH=7 exp_F   mu 0.13842086
11  Combi pH=7 exp_F   mu 0.12778964
12     ORD0793 exp_F   mu 0.13910441
13     ORD0793 exp_F   mu 0.12603702
14     ORD0793 exp_F   mu 0.12670842
15     ORD0795 exp_F   mu 0.12982122
16     ORD0795 exp_F   mu 0.13648100
17     ORD0795 exp_F   mu 0.13593685
18     ORD0799 exp_F   mu 0.13906691
continues...
我想针对每个类型和经验组做一个像lm(mu~ORD, data=df)这样的线性调整。我已经尝试了以下方法,但并没有起作用:
intsl <- df %>% group_by(exp,type) %>%
  fortify(lm(mu~ORD)) %>%
  select(exp,type, .fitted, .resid)
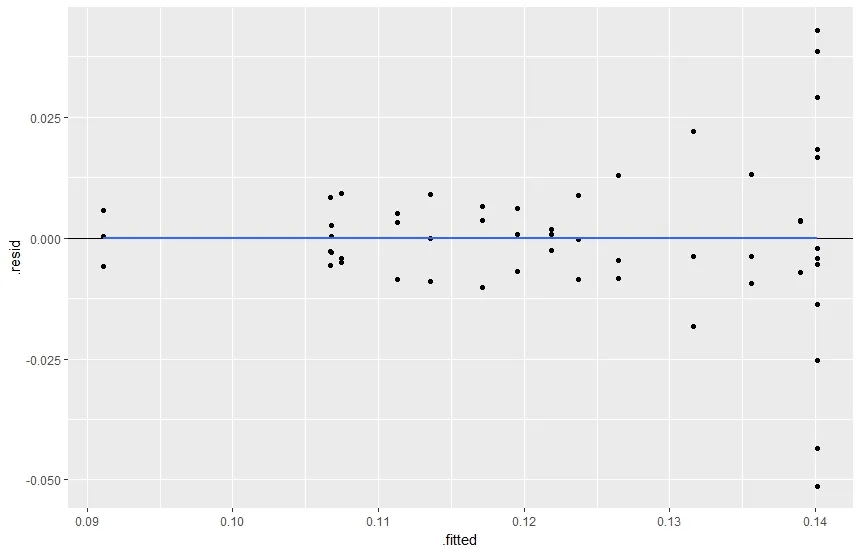
我需要使用Fortify,因为我需要.fitted和.resid字段,以便稍后使用ggplot中的facet_grid对类型和实验进行多图排序,以检查每个拟合模型中是否存在异方差性。就像这样,但是要有一个有组织的多图:
 有什么建议吗? :<
modelr包使许多回归任务变得更加容易。 - Andrew Brēzabroom::augment的答案之外,听起来你只需要在 ggplot 调用中添加+facet_grid(type ~exp)。 - Brian