使用Graphviz显示此决策树

3
我正在跟随一个使用Python v3.6的教程,使用Scikit-learn进行机器学习的决策树编程。

以下是代码:

import pandas as pd
import numpy as np
import matplotlib.pyplot as plt
import mglearn
import graphviz

from sklearn.datasets import load_breast_cancer
from sklearn.model_selection import train_test_split

from sklearn.tree import DecisionTreeClassifier

cancer = load_breast_cancer()
X_train, X_test, y_train, y_test = train_test_split(cancer.data, cancer.target, stratify=cancer.target, random_state=42)
tree = DecisionTreeClassifier(random_state=0)
tree.fit(X_train, y_train)

tree = DecisionTreeClassifier(max_depth=4, random_state=0)
tree.fit(X_train, y_train)

from sklearn.tree import export_graphviz
export_graphviz(tree, out_file="tree.dot", class_names=["malignant", "benign"],feature_names=cancer.feature_names, impurity=False, filled=True)

import graphviz
with open("tree.dot") as f:
    dot_graph = f.read()
graphviz.Source(dot_graph)

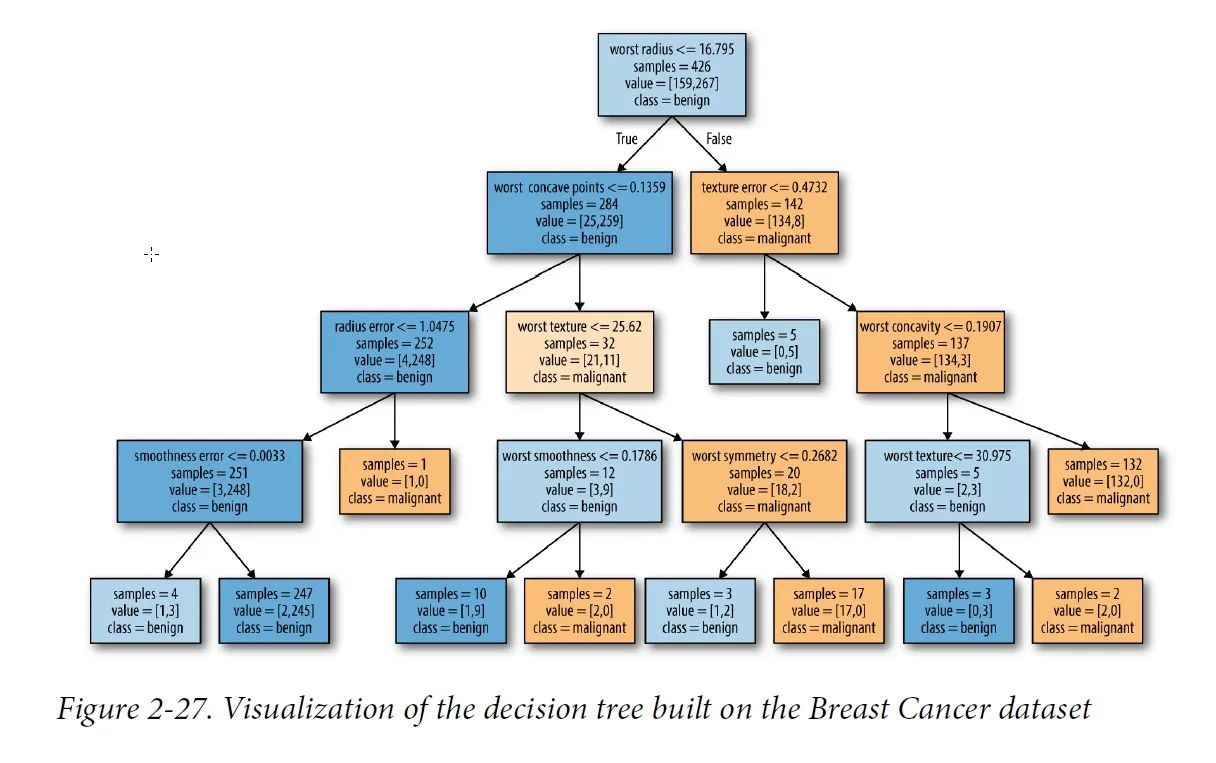
我该如何使用Graphviz来查看dot_graph中的内容?预计它应该是这样的:

enter image description here


1
请查看export_graphviz函数,通过该函数您可以将.dot文件转换为其他格式,如.png。 - Jakub Macina
5个回答

8
在Jupyter笔记本中,以下内容绘制决策树:
from sklearn.tree import DecisionTreeClassifier
from sklearn import tree


model = DecisionTreeClassifier()
model.fit(X, y)
dot_data = tree.export_graphviz(model, 
                  feature_names=feature_names,  
                  class_names=class_names,  
                  filled=True, rounded=True,  
                  special_characters=True,
                   out_file=None,
                           )
graph = graphviz.Source(dot_data)
graph

如果您想将其保存为PNG文件:

graph.format = "png"
graph.render("file_name")

5

graphviz.Source(dot_graph) 返回一个 graphviz.files.Source 对象。

该方法返回的是一个graphviz.files.Source对象。
g = graphviz.Source(dot_graph)

使用 g.render() 可以创建一个图像文件。当我在您的代码中没有使用参数运行它时,我得到了一个 Source.gv.pdf,但是您可以指定不同的文件名。还有一种快捷方式 g.view(),它会保存文件并在适当的查看器应用程序中打开它。
如果您将代码粘贴为原样在一个富终端(例如Spyder/IPython和内联图形或Jupyter笔记本)中,它将自动显示图像而不是对象的Python表示。

2
你可以使用IPython.display中的display。以下是一个例子:
你可以使用IPython.display中的display函数。这是一个例子:
from sklearn.tree import DecisionTreeClassifier
from sklearn import tree

model = DecisionTreeClassifier()
model.fit(X, y)

from IPython.display import display
display(graphviz.Source(tree.export_graphviz(model)))

1

我在 Windows 10 上工作。 我通过将路径添加到“path”环境变量中来解决了此问题。 我添加了错误的路径,即 Drive:\ Users \ User.Name \ AppData \ Local \ Continuum \ anaconda3 \ envs \ MyVirtualEnv \ lib \ site-packages \ graphviz, 应该使用 Drive:\ Users \ User.Name \ AppData \ Local \ Continuum \ anaconda3 \ envs \ MyVirtualEnv \ Library \ bin \ graphviz。 最后我两者都使用了,然后重新启动了 Python / Anaconda。 还添加了 pydotplus 路径,它在 ....MyVirtualEnv \ lib \ site-packages \ pydotplus 中。


1
你不应该在多个问题上复制你的答案。如果这两个问题确实可以用同一种方式来回答,那么应该将它们标记为重复。 - Das_Geek

1
Jupyter会按原样显示图表,但如果您想要更深入地缩放,可以尝试保存文件并进一步检查:
# Draw graph
graph = pydotplus.graph_from_dot_data(dot_data)  

# Show graph
Image(graph.create_png())

网页内容由stack overflow 提供, 点击上面的
可以查看英文原文,
原文链接