通常我使用shell命令time。我的目的是测试数据集是否小型、中型、大型或非常大型,需要多长时间和内存才能完成。
有没有适用于Linux或Python的工具来实现这个目的?
通常我使用shell命令time。我的目的是测试数据集是否小型、中型、大型或非常大型,需要多长时间和内存才能完成。
有没有适用于Linux或Python的工具来实现这个目的?
可以参考timeit、Python分析器和pycallgraph,还要注意查看下方的nikicc的评论,提到了SnakeViz。它可以给你另一种有用的分析数据的可视化。
def test():
    """Stupid test function"""
    lst = []
    for i in range(100):
        lst.append(i)

if __name__ == '__main__':
    import timeit
    print(timeit.timeit("test()", setup="from __main__ import test"))

    # For Python>=3.5 one can also write:
    print(timeit.timeit("test()", globals=locals()))
import cProfile
import re
cProfile.run('re.compile("foo|bar")')
这将给你:
      197 function calls (192 primitive calls) in 0.002 seconds

Ordered by: standard name

ncalls  tottime  percall  cumtime  percall filename:lineno(function)
     1    0.000    0.000    0.001    0.001 <string>:1(<module>)
     1    0.000    0.000    0.001    0.001 re.py:212(compile)
     1    0.000    0.000    0.001    0.001 re.py:268(_compile)
     1    0.000    0.000    0.000    0.000 sre_compile.py:172(_compile_charset)
     1    0.000    0.000    0.000    0.000 sre_compile.py:201(_optimize_charset)
     4    0.000    0.000    0.000    0.000 sre_compile.py:25(_identityfunction)
   3/1    0.000    0.000    0.000    0.000 sre_compile.py:33(_compile)
这两个模块都可以帮助您找到瓶颈所在。
此外,要理解profile的输出,可以查看此贴子
注意 pycallgraph已经在2018年2月被官方放弃。但截至2020年12月,它仍然适用于Python 3.6。 只要Python暴露出来的性能分析API没有核心更改,它就应该仍然是一个有用的工具。
该模块使用Graphviz创建如下图所示的调用图:
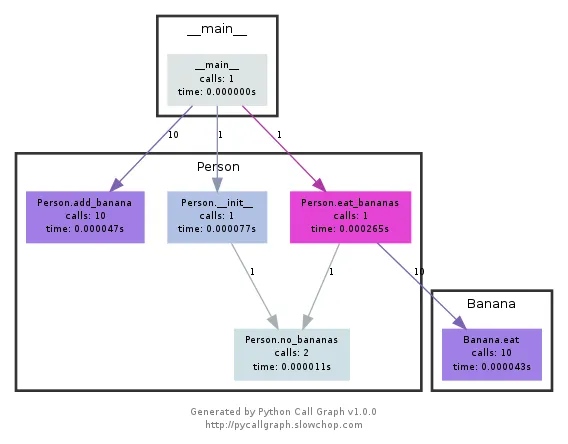
您可以通过颜色轻松看出哪些路径使用了最多的时间。 您可以使用pycallgraph API或使用打包的脚本来创建它们:
pycallgraph graphviz -- ./mypythonscript.py
然而,开销相当大。因此对于已经运行了很长时间的进程,创建图表可能需要一些时间。
import time

def st_time(func):
    """
        st decorator to calculate the total time of a func
    """

    def st_func(*args, **keyArgs):
        t1 = time.time()
        r = func(*args, **keyArgs)
        t2 = time.time()
        print("Function=%s, Time=%s" % (func.__name__, t2 - t1))
        return r

    return st_func
timeit模块速度慢且操作怪异,因此我编写了以下代码:
def timereps(reps, func):
    from time import time
    start = time()
    for i in range(0, reps):
        func()
    end = time()
    return (end - start) / reps
示例:
import os
listdir_time = timereps(10000, lambda: os.listdir('/'))
print "python can do %d os.listdir('/') per second" % (1 / listdir_time)
对我来说,它显示:
python can do 40925 os.listdir('/') per second
这是一种基本的性能测试方法,但足够好用。
我通常会快速执行 time ./script.py 命令来查看脚本的运行时间。但是默认情况下,此命令不会显示内存使用情况。您可以使用 /usr/bin/time -v ./script.py 命令获取大量信息,包括内存使用情况。
/usr/bin/time命令,需要进行安装。
在Debian、Ubuntu等系统中,可以使用sudo apt-get install time命令进行安装。
在ArchLinux中,可以使用pacman -S time命令进行安装。 - Rui Andrada为满足您的所有内存需求,我们提供了一个内存分析工具。
https://pypi.python.org/pypi/memory_profiler
只需运行pip安装即可:
pip install memory_profiler
导入库:
import memory_profiler
@profile
def my_func():
    a = [1] * (10 ** 6)
    b = [2] * (2 * 10 ** 7)
    del b
    return a

if __name__ == '__main__':
    my_func()
执行代码:
python -m memory_profiler example.py
接收输出:
 Line #    Mem usage  Increment   Line Contents
 ==============================================
 3                           @profile
 4      5.97 MB    0.00 MB   def my_func():
 5     13.61 MB    7.64 MB       a = [1] * (10 ** 6)
 6    166.20 MB  152.59 MB       b = [2] * (2 * 10 ** 7)
 7     13.61 MB -152.59 MB       del b
 8     13.61 MB    0.00 MB       return a
这里提供的例子来自上面链接的文档。
pip install line_profiler
@profile装饰器。例如:@profile
def function(base, index, shift):
addend = index << shift
result = base + addend
return result
kernprof -l <file_name> 创建一个 line_profiler 实例。例如:kernprof -l test.py
kernprof成功时将打印Wrote profile results to <file_name>.lprof。例如:
Wrote profile results to test.py.lprof
python -m line_profiler <file_name>.lprof打印基准结果。例如:python -m line_profiler test.py.lprof
Timer unit: 1e-06 s

Total time: 0.0021632 s
File: test.py
Function: function at line 1

Line #      Hits         Time  Per Hit   % Time  Line Contents
==============================================================
     1                                           @profile
     2                                           def function(base, index, shift):
     3      1000        796.4      0.8     36.8      addend = index << shift
     4      1000        745.9      0.7     34.5      result = base + addend
     5      1000        620.9      0.6     28.7      return result
pip install memory_profiler
@profile装饰器。例如:@profile
def function():
result = []
for i in range(10000):
result.append(i)
return result
python -m memory_profiler <file_name>打印基准测试结果。例如:python -m memory_profiler test.py
您将看到有关每行代码的详细信息:
Filename: test.py

Line #    Mem usage    Increment  Occurences   Line Contents
============================================================
     1   40.246 MiB   40.246 MiB           1   @profile
     2                                         def function():
     3   40.246 MiB    0.000 MiB           1       result = []
     4   40.758 MiB    0.008 MiB       10001       for i in range(10000):
     5   40.758 MiB    0.504 MiB       10000           result.append(i)
     6   40.758 MiB    0.000 MiB           1       return result
为了最小化环境影响,多次调用函数。
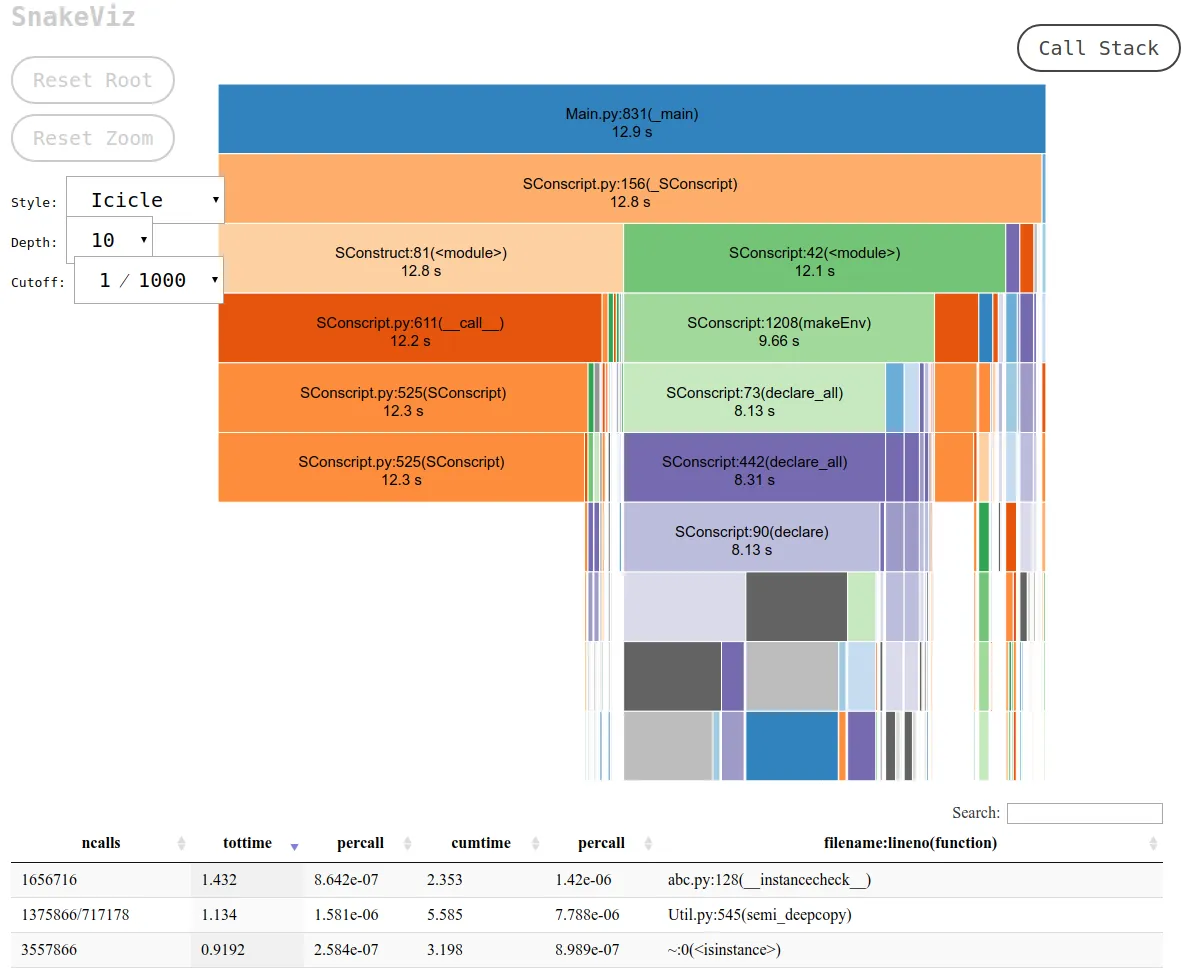
snakeviz 交互式查看器,用于 cProfile
https://github.com/jiffyclub/snakeviz/
cProfile 在这里和这里被提到过,而 snakeviz 则在一条评论中被提及,但我想更深入地介绍它。
仅仅通过查看cprofile / pstats输出来调试程序性能非常困难,因为它们只能按函数总时间进行累计。
然而,我们通常需要的是一个嵌套视图,其中包含每个调用的堆栈跟踪,以便轻松找到主要瓶颈。
这正是 snakeviz 默认的“icicle”视图所提供的。
首先,您必须将 cProfile 数据转储到二进制文件中,然后才能在 snakeviz 上查看。
pip install -u snakeviz
python -m cProfile -o results.prof myscript.py
snakeviz results.prof
 。然后您可以:
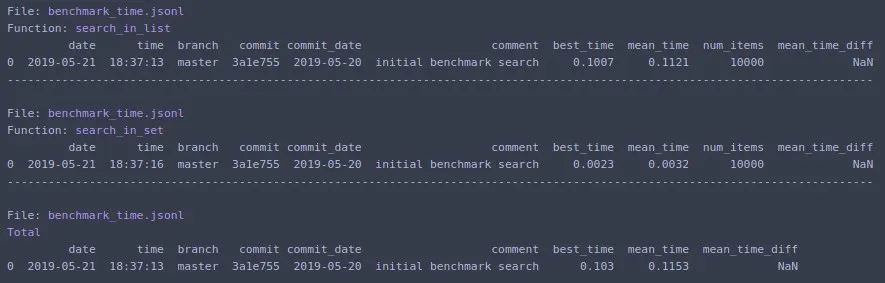
# pip install benchmarkit

from benchmarkit import benchmark, benchmark_run

N = 10000
seq_list = list(range(N))
seq_set = set(range(N))

SAVE_PATH = '/tmp/benchmark_time.jsonl'

@benchmark(num_iters=100, save_params=True)
def search_in_list(num_items=N):
    return num_items - 1 in seq_list

@benchmark(num_iters=100, save_params=True)
def search_in_set(num_items=N):
    return num_items - 1 in seq_set

benchmark_results = benchmark_run(
   [search_in_list, search_in_set],
   SAVE_PATH,
   comment='initial benchmark search',
)
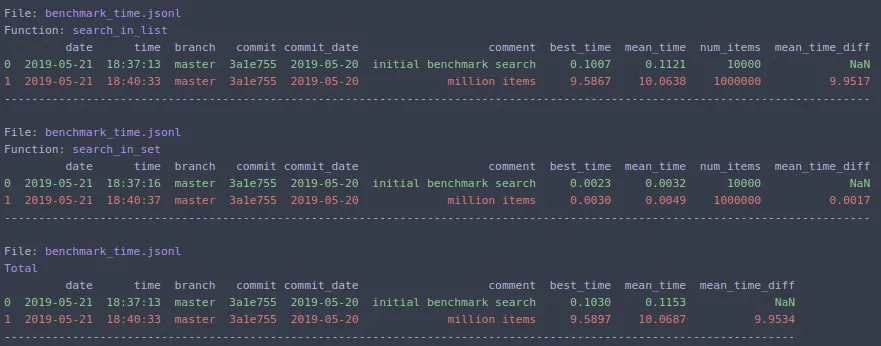
如果您更改N = 1000000并重新运行
$: nosetests
这个命令将在当前目录中查找所有的 Python 文件,并执行任何被识别为测试的函数:例如,它会识别名称中带有 test_ 的函数作为测试。
因此,你只需要创建一个名为 test_yourfunction.py 的 Python 脚本,并在其中编写如下内容:
$: cat > test_yourfunction.py

def test_smallinput():
    yourfunction(smallinput)

def test_mediuminput():
    yourfunction(mediuminput)

def test_largeinput():
    yourfunction(largeinput)
那么您需要运行
$: nosetest --with-profile --profile-stats-file yourstatsprofile.prof testyourfunction.py
要读取配置文件,请使用以下Python代码:
python -c "import hotshot.stats ; stats = hotshot.stats.load('yourstatsprofile.prof') ; stats.sort_stats('time', 'calls') ; stats.print_stats(200)"
nose 依赖于 hotshot。自 Python 2.5 以来就不再维护了,只保留了“专业用途”。 - exhuma请注意,timeit非常缓慢,仅初始化(或者运行函数)就需要在我的中等处理器上花费12秒钟。您可以测试这个被接受的答案。
def test():
    lst = []
    for i in range(100):
        lst.append(i)

if __name__ == '__main__':
    import timeit
    print(timeit.timeit("test()", setup="from __main__ import test")) # 12 second
time替代,我的电脑上返回结果0.0。import time
def test():
lst = []
for i in range(100):
lst.append(i)
t1 = time.time()
test()
result = time.time() - t1
print(result) # 0.000000xxxx
python -m cProfile -o results.prof myscript.py。然后,可以使用名为 SnakeViz 的程序在浏览器中非常好地展示输出文件,方法是使用snakeviz results.prof。 - nikiccpip install pycallgraph命令安装了 pycallgraph。但是当我在脚本上运行上面的命令时,出现了以下错误:'pycallgraph' is not recognized as an internal or external command, operable program or batch file.你有任何想法是为什么吗? - Gilfoylepip install时,它会在特定文件夹中创建可执行文件,该文件夹需要在您的PATH环境变量中。这取决于您的 Python 安装。我建议将这些工具安装到您的虚拟环境中,或通过 pipx 进行安装。pipx 仍然需要您在PATH上拥有适当的文件夹,但可以更轻松地管理可执行文件。 - exhumatimeit.timeit(stmt='print(1)')如你所见,我只是没有为计时器指定任何内容。只有在需要非标准计时函数时才需要指定它。这可能超出了本回答的范围,你应该查阅官方的Python文档。 - exhuma