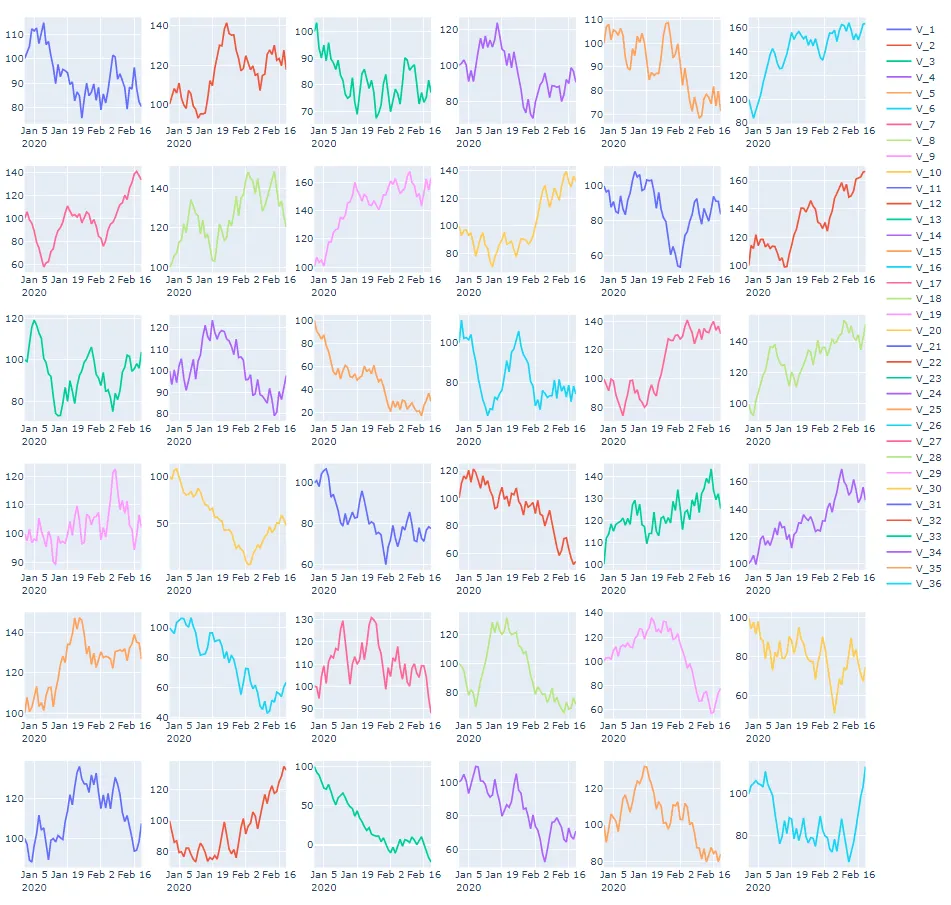
情节:
代码:
from plotly.subplots import make_subplots
import plotly.graph_objs as go
import pandas as pd
import numpy as np
np.random.seed(123)
frame_rows = 50
n_plots = 36
frame_columns = ['V_'+str(e) for e in list(range(n_plots+1))]
df = pd.DataFrame(np.random.uniform(-10,10,size=(frame_rows, len(frame_columns))),
index=pd.date_range('1/1/2020', periods=frame_rows),
columns=frame_columns)
df=df.cumsum()+100
df.iloc[0]=100
plot_rows=6
plot_cols=6
fig = make_subplots(rows=plot_rows, cols=plot_cols)
x = 0
for i in range(1, plot_rows + 1):
for j in range(1, plot_cols + 1):
fig.add_trace(go.Scatter(x=df.index, y=df[df.columns[x]].values,
name = df.columns[x],
mode = 'lines'),
row=i,
col=j)
x=x+1
fig.update_layout(height=1200, width=1200)
fig.show()
补充: 一列式解决方案:
代码:
from plotly.subplots import make_subplots
import plotly.graph_objs as go
import pandas as pd
import numpy as np
np.random.seed(123)
frame_rows = 50
frame_columns = ['V_'+str(e) for e in list(range(1,37))]
df = pd.DataFrame(np.random.uniform(-8,10,size=(frame_rows, len(frame_columns))),
index=pd.date_range('1/1/2020', periods=frame_rows),
columns=frame_columns)
df=df.cumsum()+100
df.iloc[0]=100
plot_rows=6
plot_cols=6
lst1 = list(range(1,plot_rows+1))
lst2 = list(range(1,plot_cols+1))
fig = make_subplots(rows=36, cols=1, subplot_titles=df.columns, insets=[{'l': 0.1, 'b': 0.1, 'h':1}])
x = 1
for i in lst1:
for j in lst2:
fig.add_trace(go.Scatter(x=df.index, y=df[df.columns[x-1]].values,
name = df.columns[x-1],
mode = 'lines',
),
row=x,
col=1)
x=x+1
fig.update_layout(height=12000, width=1200)
fig.show()
图表:
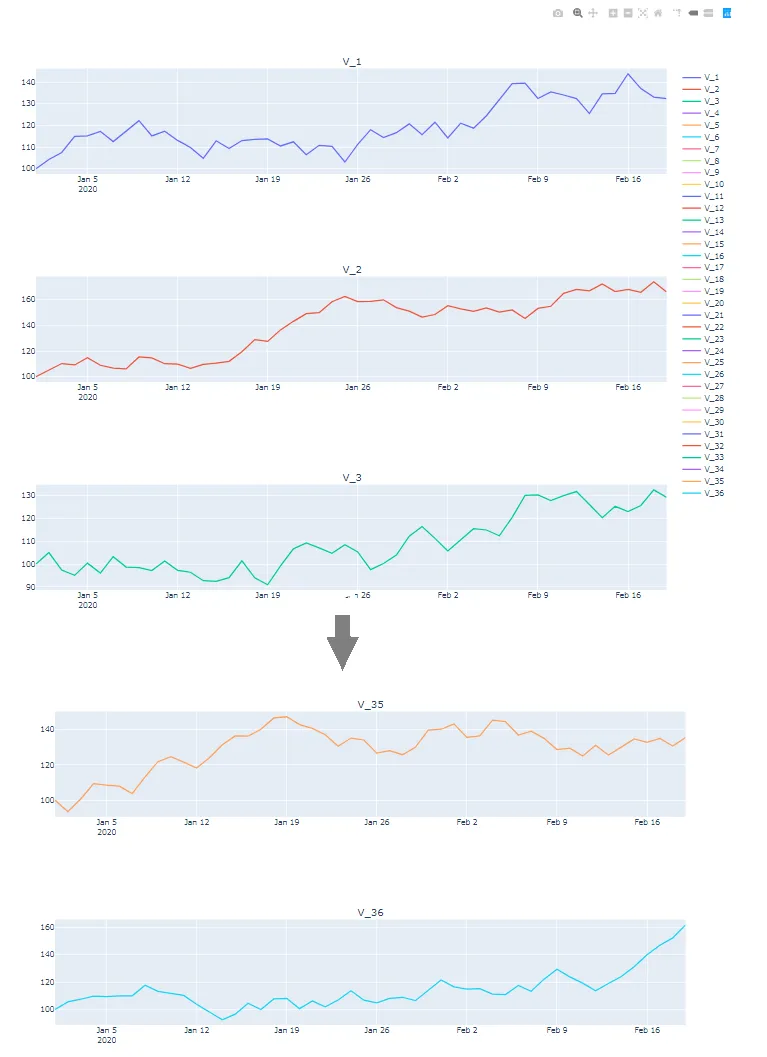

fig.update_layout(height=12000, width=1200)。 - vestland