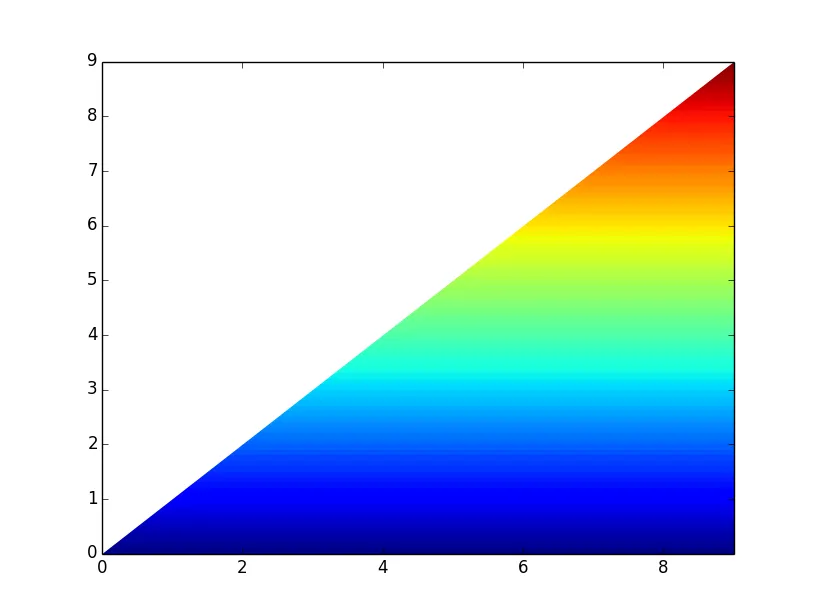
我想知道是否有一种方法可以使用垂直渐变来填充pyplot曲线下面的区域,就像这个快速模型中一样:

我在StackOverflow上找到了这个hack,如果我能找出如何使颜色图垂直,我不介意使用多边形:How to fill rainbow color under a curve in Python matplotlib
我想知道是否有一种方法可以使用垂直渐变来填充pyplot曲线下面的区域,就像这个快速模型中一样:

我在StackOverflow上找到了这个hack,如果我能找出如何使颜色图垂直,我不介意使用多边形:How to fill rainbow color under a curve in Python matplotlib
可能有更好的方法,但这里就是一个:
from matplotlib import pyplot as plt

x = range(10)
y = range(10)
z = [[z] * 10 for z in range(10)]
num_bars = 100  # more bars = smoother gradient

plt.contourf(x, y, z, num_bars)

background_color = 'w'
plt.fill_between(x, y, y2=max(y), color=background_color)

plt.show()
展示:

有一种更接近问题草图的替代方案。在Henry Barthes的博客http://pradhanphy.blogspot.com/2014/06/filling-between-curves-with-color.html上给出了该方案。 这将每个补丁都应用了imshow,我已经复制了代码以防链接更改,
import numpy as np
import matplotlib.pyplot as plt
from matplotlib.path import Path
from matplotlib.patches import PathPatch

xx=np.arange(0,10,0.01)
yy=xx*np.exp(-xx)

path = Path(np.array([xx,yy]).transpose())
patch = PathPatch(path, facecolor='none')
plt.gca().add_patch(patch)

im = plt.imshow(xx.reshape(yy.size,1),
                cmap=plt.cm.Reds,
                interpolation="bicubic",
                origin='lower',
                extent=[0,10,-0.0,0.40],
                aspect="auto",
                clip_path=patch,
                clip_on=True)
plt.show()
plt.imshow来进行渐变填充,而不是plt.contourf。请参考我在另一个问题中的回答。 - Mr Tsjolder