我正在使用sns.lineplot在图表中显示置信区间。
sns.lineplot(x = threshold, y = mrl_array, err_style = 'band', ci=95)
plt.show()
我得到了以下的图表,但它没有显示置信区间:
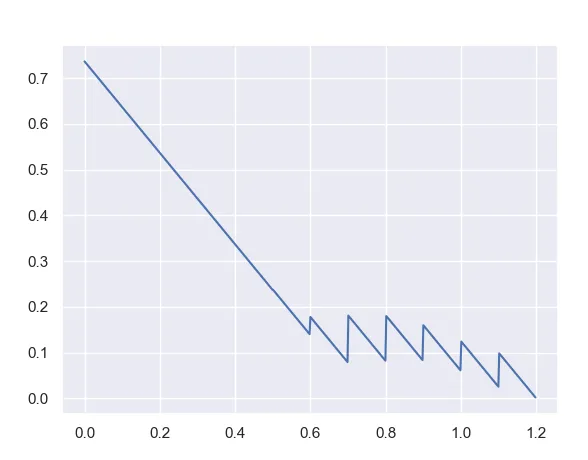
有什么问题吗?
我正在使用sns.lineplot在图表中显示置信区间。
sns.lineplot(x = threshold, y = mrl_array, err_style = 'band', ci=95)
plt.show()
有什么问题吗?
seaborn v0.12.0 开始,ci 参数已更改为 errorbar。
errorbar:字符串、(字符串、数字) 元组、可调用对象或None误差线方法的名称(可以是'ci'、'pi'、'se'或'sd'),或者是一个方法名称和一个级别参数的元组,或者是从向量到 (min, max) 区间映射的函数,或者是None以隐藏误差线。
默认值为 errorbar=('ci', 95)
ci:与估计器聚合时绘制置信区间的大小。'sd'表示绘制数据的标准偏差。将其设置为None将跳过 引导重采样。
seaborn.lineplot 的示例。kind='line' 的 sns.relplot 也是如此。sns.lineplot,但本答案适用于显示置信区间的任何seaborn plot,例如seaborn.barplot。import seaborn as sns
# load data
flights = sns.load_dataset("flights")
year month passengers
0 1949 Jan 112
1 1949 Feb 118
2 1949 Mar 132
3 1949 Apr 129
4 1949 May 121
# only May flights
may_flights = flights.query("month == 'May'")

     year month  passengers
4    1949   May         121
16   1950   May         125
28   1951   May         172
40   1952   May         183
52   1953   May         229
64   1954   May         234
76   1955   May         270
88   1956   May         318
100  1957   May         355
112  1958   May         363
124  1959   May         420
136  1960   May         472

# standard deviation for each year of May data
may_flights.set_index('year')[['passengers']].std(axis=1)

year
1949   NaN
1950   NaN
1951   NaN
1952   NaN
1953   NaN
1954   NaN
1955   NaN
1956   NaN
1957   NaN
1958   NaN
1959   NaN
1960   NaN
dtype: float64
# flight in wide format
flights_wide = flights.pivot("year", "month", "passengers")

month  Jan  Feb  Mar  Apr  May  Jun  Jul  Aug  Sep  Oct  Nov  Dec
year
1949   112  118  132  129  121  135  148  148  136  119  104  118
1950   115  126  141  135  125  149  170  170  158  133  114  140
1951   145  150  178  163  172  178  199  199  184  162  146  166
1952   171  180  193  181  183  218  230  242  209  191  172  194
1953   196  196  236  235  229  243  264  272  237  211  180  201
1954   204  188  235  227  234  264  302  293  259  229  203  229
1955   242  233  267  269  270  315  364  347  312  274  237  278
1956   284  277  317  313  318  374  413  405  355  306  271  306
1957   315  301  356  348  355  422  465  467  404  347  305  336
1958   340  318  362  348  363  435  491  505  404  359  310  337
1959   360  342  406  396  420  472  548  559  463  407  362  405
1960   417  391  419  461  472  535  622  606  508  461  390  432

# standard deviation for each year
flights_wide.std(axis=1)

year
1949    13.720147
1950    19.070841
1951    18.438267
1952    22.966379
1953    28.466887
1954    34.924486
1955    42.140458
1956    47.861780
1957    57.890898
1958    64.530472
1959    69.830097
1960    77.737125
dtype: float64
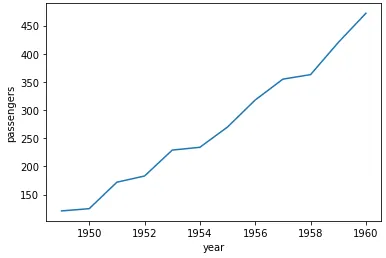
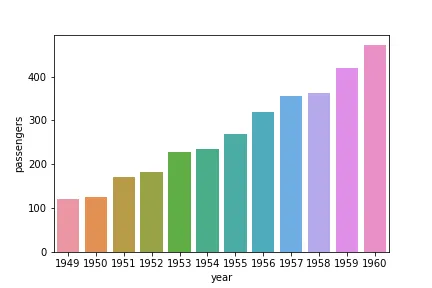
may_flights 每年只有一个观测值,因此不显示置信区间。sns.lineplot(data=may_flights, x="year", y="passengers")
sns.barplot(data=may_flights, x='year', y='passengers')
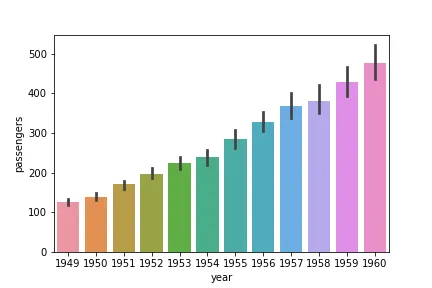
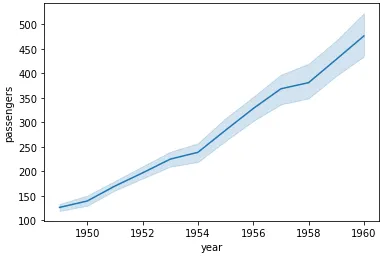
flights_wide 显示每年有十二个观测值,因此置信区间显示了当绘制所有flights时的情况。sns.lineplot(data=flights, x="year", y="passengers")
sns.barplot(data=flights, x='year', y='passengers')