这个问题非常有帮助,特别是@Mr Tsjolder的回答。根据您的问题进行适应,您需要从计算出的角度中减去90才能获得想要的结果:
import matplotlib.pyplot as plt
import numpy as np
from matplotlib import transforms
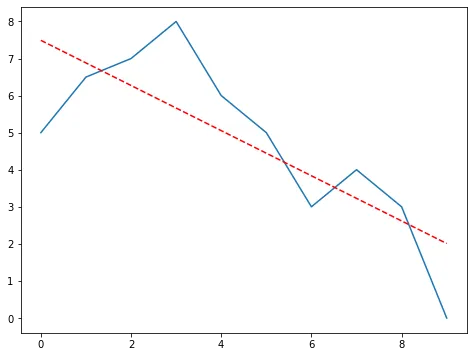
x = [5, 6.5, 7, 8, 6, 5, 3, 4, 3, 0]
y = range(len(x))
best_fit_line = np.poly1d(np.polyfit(y, x, 1))(y)
angle = np.rad2deg(np.arctan2(y[-1] - y[0], best_fit_line[-1] - best_fit_line[0]))
print("angle: " + str(angle))
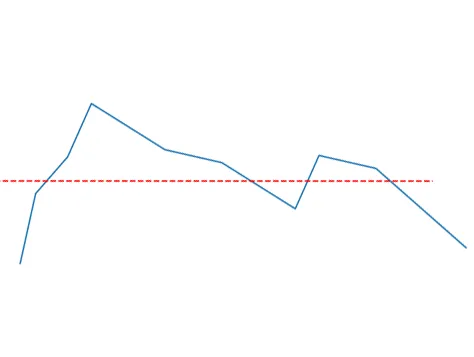
plt.figure(figsize=(8, 6))
base = plt.gca().transData
rotation = transforms.Affine2D().rotate_deg(angle - 90)
plt.plot(x, transform = rotation + base)
plt.plot(best_fit_line, "--", color="r", transform = rotation + base)
后续问题:如果我们只需要旋转后点的数值呢?
这时候,使用matplotlib的方法仍然很有用。根据我们前面介绍的rotation对象,matplotlib可以提取变换矩阵,我们可以用它来转换任何点:
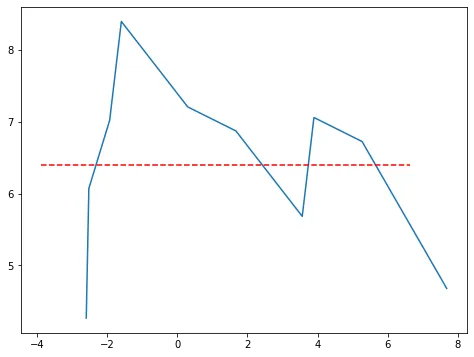
M = transforms.Affine2DBase.get_matrix(rotation)[:2, :2]
print((M * [0, 5])[:, 1])
[-2.60096617 4.27024297]
对所需的维度进行了切片,因为旋转只发生在二维平面上。您可以看到,原始数据中的第一个点被转换为(-2.6,4.3),与我上面旋转图形的绘制结果一致。
通过这种方式,您可以旋转任何感兴趣的点,或编写循环以捕获它们全部。