我正在尝试使用matplotlib 2.0和其中的animation模块来为我的networkx图形添加动画效果。我看到了Using NetworkX with matplotlib.ArtistAnimation和Animate graph diffusion with NetworkX,但即使有伪代码,我也无法理解这些更新函数是如何工作的。
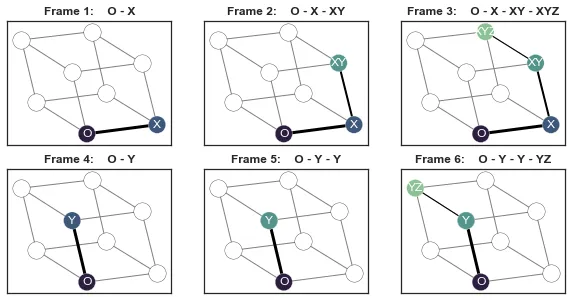
我想要逐步遍历一系列字母(节点),然后绘制从原点"O"到当前步骤的路径。查看下面的绘图将更容易理解。我不想将它们渲染出来以在Python 3.6之外生成.mp4文件。我认为这会是一个很好的资源,供人们了解这些更新函数如何操作以及如何应用于可视化网络。
我该如何使用update function来为下面的networkx图形添加动画效果?
显然,动画不会显示在具有不同ax对象的matplotlib figure上,但这只是为了说明如何布置帧。
import networkx as nx
import numpy as np
import matplotlib.pyplot as plt
import seaborn as sns
import matplotlib.animation as animation


def update_func(num, data, line):
    # https://matplotlib.org/2.0.0/examples/animation/basic_example.html
    line.set_data(data[..., :num])
    return line

# Create Graph
np.random.seed(2)
G = nx.cubical_graph()
G = nx.relabel_nodes(G, {0:"O", 1:"X", 2:"XZ", 3:"Z", 4:"Y", 5:"YZ", 6: "XYZ", 7:"XY"})
pos = nx.spring_layout(G)

# Sequence of letters
sequence_of_letters = "".join(['X', 'Y', 'Z', 'Y', 'Y', 'Z']) #np.random.RandomState(0).choice(list("XYZ"), size=6, replace=True)
idx_colors = sns.cubehelix_palette(5, start=.5, rot=-.75)[::-1]
idx_weights = [3,2,1]

# General graph structure
with plt.style.context("seaborn-white"):
    fig, ax = plt.subplots()
    nx.draw(G, pos=pos, with_labels=True, ax=ax)
    print(ax.get_xlim(), ax.get_ylim())
# (-0.10500000000000001, 1.105) (-0.088398066788676247, 0.93028441715702148)

# Build plot
with plt.style.context("seaborn-white"):
    fig, axes = plt.subplots(ncols=3, nrows=2, figsize=(10,5))
    for i in range(0, len(sequence_of_letters), 3):
        triad = sequence_of_letters[i:i+3]
        for j in range(1,4):
            # Axes index for rows and cols
            idx = i + j - 1
            row_idx, col_idx = {True: (0,idx), False: (1,idx - 3)}[idx < 3]
            ax = axes[row_idx][col_idx]

            # Path in Graph
            path = ["O"] + ["".join(sorted(set(triad[:k + 1]))) for k in range(j)]

           # Background nodes
            nx.draw_networkx_edges(G, pos=pos, ax=ax, edge_color="gray")
            null_nodes = nx.draw_networkx_nodes(G, pos=pos, nodelist=set(G.nodes()) - set(path), node_color="white",  ax=ax)
            null_nodes.set_edgecolor("black")

            # Query nodes
            query_nodes = nx.draw_networkx_nodes(G, pos=pos, nodelist=path, node_color=idx_colors[:len(path)], ax=ax)
            query_nodes.set_edgecolor("white")
            nx.draw_networkx_labels(G, pos=pos, labels=dict(zip(path,path)),  font_color="white", ax=ax)
            edgelist = [path[k:k+2] for k in range(len(path) - 1)]
            nx.draw_networkx_edges(G, pos=pos, edgelist=edgelist, width=idx_weights[:len(path)], ax=ax)

            # Scale plot ax
            ax.set_title("Frame %d:    "%(idx+1) +  " - ".join(path), fontweight="bold")
            ax.set_xlim((-0.10500000000000001, 1.105))
            ax.set_ylim((-0.088398066788676247, 0.93028441715702148))
            ax.set_xticks([])
            ax.set_yticks([])