ggplot中饼图中心的空洞

5

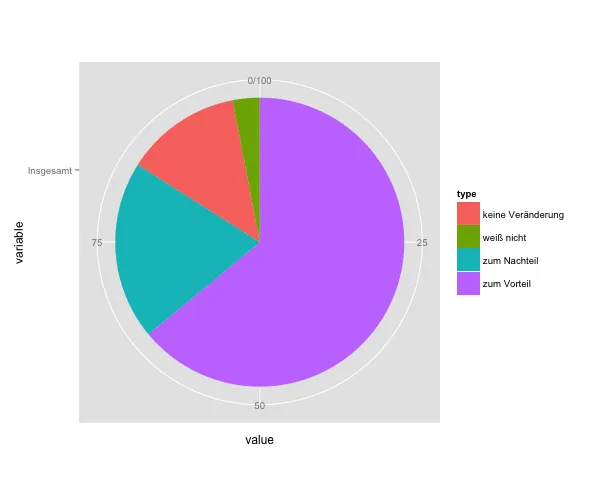
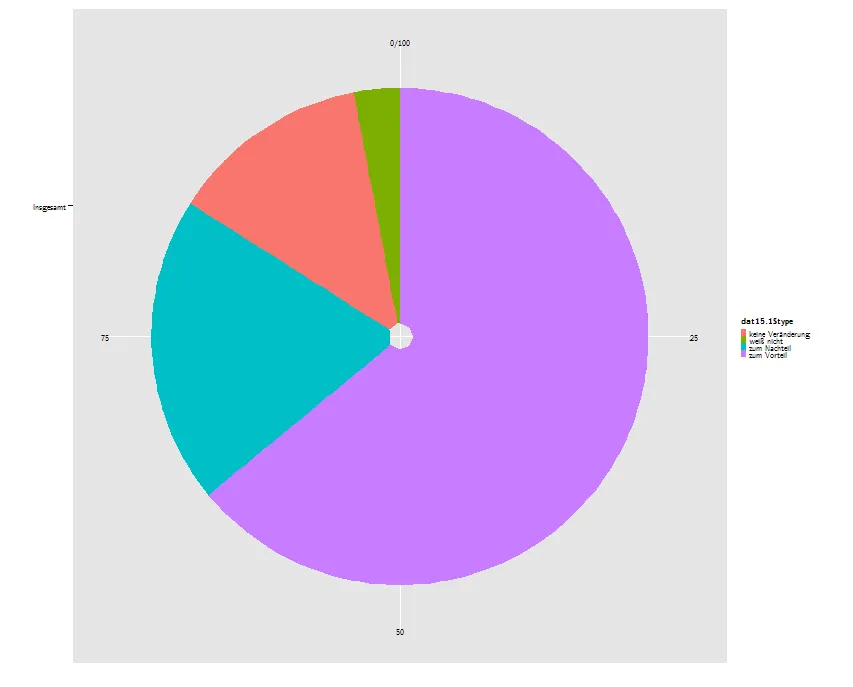
我想不通,为什么ggplot会在下面的图中间绘制一个洞:

enter image description here

这里是数据和代码:

dat15 <- data.frame("Insgesamt" = c(64, 20, 13, 3),
              "18-29" = c(41, 25, 27, 7),
              "30-44" = c(58, 25, 12, 5),
              "45-59"=c(69, 20, 10, 1),
              "60+" = c(76, 14, 9, 1),
              "Arbeiter" = c(57, 34, 9, 0),
              "Angestellte" = c(69, 17, 11, 3),
              "Beamte" = c(72, 12, 11, 5),
              "Selbstständige" = c(69, 23, 5, 3),
              "unter 1000" = c(47, 30, 19, 4),
              "1000-2000" = c(59, 24, 15, 2),
              "2000-3000" = c(72, 15, 10, 3),
              "3000+" = c(68, 19, 10, 3),
              "seit Geburt" = c(65, 19, 12, 4),
              "zugez. vor 20" = c(72, 17, 9, 2),
              "zugez. in 20" = c(46, 28, 19, 7),
              row.names = c("zum Vorteil", "zum Nachteil", "keine Veränderung", "weiß nicht"))

dat15 <- melt(dat15)
dat15$type = c("zum Vorteil", "zum Nachteil", "keine Veränderung", "weiß nicht")
dat15.1 <- dat15[c(1:4),]
dat15.1$labelpos <- cumsum(dat15.1$value) - dat15.1$value / 2


plot15.1 <- ggplot()  + 
    theme_m(base_family = family,base_size=size) + xlab("") + ylab("") 

plot15.1 <- plot15.1 + 
    geom_bar(ata = dat15.1, aes(x = dat15.1$variable, y = dat15.1$value, 
        fill=dat15.1$type), stat = 'identity')

plot15.1 <- plot15.1 + coord_polar("y", start = 0)
2个回答

13

如果您在geom_bar中添加参数 width=1,它将起作用:

ggplot()  + 
  geom_bar(data = dat15.1, aes(x = variable, y = value, fill = type), 
           stat = 'identity', width = 1) + 
  coord_polar("y", start = 0)

在此输入图片描述


谢谢你,伙计...那是我最后会检查的东西 -.-' - Martin Schmelzer

2

另一种基于帮助手册示例的方法是将x设置为1,这被称为“虚拟”值:

ggplot()  + 
    geom_bar(data = dat15.1, aes(x = 1, y = value, fill = type), 
             stat = 'identity') + 
    coord_polar("y", start = 0)

有时候,使用aes_string()更加方便:
ggplot()  + 
    geom_bar(data = dat15.1, aes_string(x = 1, y = 'value', fill = 'type'), 
             stat = 'identity') + 
    coord_polar("y", start = 0)

截至2016年5月,输出结果与Sven Hohenstein在接受的答案中所示完全相同。 我无法评论将放在内还是将放在内更为合适。

1
由于“ggplot2”经常更新,因此这两种方法中的一种在未来可能会过时,因此我认为列出第二种方法可能会很有用。 - PatrickT

网页内容由stack overflow 提供, 点击上面的
可以查看英文原文,
原文链接