如何控制rmarkdown/knitr文件的输出顺序(或如何防止浮动)

5
我遇到了一个类似于 'R,knitr不尊重块和文本顺序' 中提出的问题。在我的代码中,我有一个文本标题,后面是一个使用四个 knitr::kable 函数调用来显示四个表格的块。奇怪的是,表1和表2出现在标题上方,表3和表4出现在输出到PDF的下方。看起来这与 knitr 允许对象浮动有关。我能否关闭它,最好在 knitr::kable 函数或块选项中?这是我的代码:
---
title: "Reproducible Error"
author: "Rex Macey"
date: "February 14, 2017"
output: pdf_document
header-includes: 
- \usepackage{placeins}
---

```{r setup, include=FALSE}
knitr::opts_chunk$set(echo = TRUE)
```

\newpage  

# Section 1  
```{r CompTables, echo=FALSE, warning=FALSE, results='asis', out.extra='FloatBarrier'}
comptables1<-matrix(rep(c(100,200,300,400,500),3),nrow=5,ncol=3)
colnames(comptables1)<-c("Conservative","Moderate","Aggressive")
row.names(comptables1)<-c("5th %-tile","25th %-tile","50th %-tile","75th %-tile","95th %-tile")
comptables2<-matrix(0,nrow=6,ncol=3)
comptables2[1,]<-comptables1[1,]
for (i in 2:5){
    comptables2[i,]<-comptables1[i,]-comptables1[i-1,]
}
comptables<-list()
comptables[[1]]<-list(comptables1,comptables2)
comptables[[2]]<-list(comptables1,comptables2)
comptables[[3]]<-list(comptables1,comptables2)
comptables[[4]]<-list(comptables1,comptables2)

knitr::kable(comptables[[1]][1],
         caption="Table of Forecast Wealth Values: Suggested One Year",
        format.args=list(big.mark=",",floating=FALSE))

knitr::kable(comptables[[2]][1],
         caption="Table of Forecast Wealth Values: Suggested Three Years",
        format.args=list(big.mark=",",floating=FALSE))

knitr::kable(comptables[[3]][1],
         caption="Table of Forecast Wealth Values: Suggested Five Years",
        format.args=list(big.mark=",",floating=FALSE))

knitr::kable(comptables[[4]][1],
         caption="Table of Forecast Wealth Values: Suggested Ten Years",
        format.args=list(big.mark=",",floating=FALSE))
```


```{r CompChart, echo=FALSE, warning=FALSE, fig.height=4, fig.show='hold', results='asis'}
horizons <- c(1,3,5,10)
par(mfrow=c(1,2))
minv<-min(unlist(comptables[[1]][1]),unlist(comptables[[2]][1]),
          unlist(comptables[[3]][1]),unlist(comptables[[4]][1]))
maxv<-max(unlist(comptables[[1]][1]),unlist(comptables[[2]][1]),
          unlist(comptables[[3]][1]),unlist(comptables[[4]][1]))
for (h in 1:length(horizons)){
    wealth.pl.comp<-matrix(unlist(comptables[[h]][2],use.names = FALSE),ncol=3,byrow=FALSE)
    colnames(wealth.pl.comp)<-c("Cons.","Mod.","Aggr.")
    barplot(wealth.pl.comp,col=c("white","red","yellow","green","blue"),border=NA,
        main=paste("Forecast A/T Values -",horizons[h],"Years"),
        ylim=c(minv/2,maxv+minv/2))
    abline(h=250,col="darkgray")
}
par(mfrow=c(1,1))
```


\newpage    

#Section 2

我尝试了kable函数中的floating = FALSE选项以及块选项中的fig.show和results参数(包括results ='hold')。在第1节之前的新页面也是无序的。请注意,我也查看了this seemingly similar question
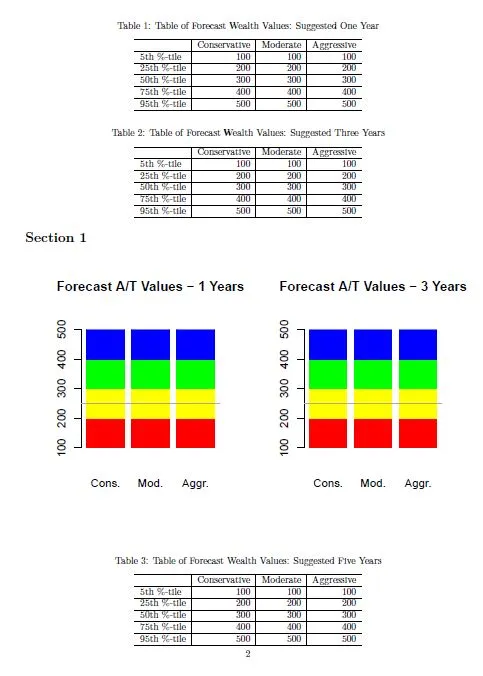
以下是输出图像。由于两个表格在文本标题“Section 1”之上,因此单个块内的文本顺序不正确。表格之间的图表来自后续块。

Image of Output


我通常在我的标题中包括\usepackage{placeins},然后在节标题之前放置\FloatBarrier,以防止浮动环境跨越到我想要的节外部。 - Benjamin
我添加了 header-includes: - \usepackage{placeIns} 并修改了代码块的头部,使其看起来像这样 {r,echo=FALSE,warning=FALSE,results='asis',out.extra='FloatBarrier'},根据 @Benjamin 的评论。但是我仍然遇到同样的问题。我应该怎么做才能有所不同? - rmacey
如果您提供一个可重现的示例,我们可以更容易地给出具体的建议。 - Benjamin
@Benjamin,你说得对,我错了。非常抱歉。我已经使用可重现的代码重新做了一遍。如果有帮助的话,我的knitr版本是v1.15.1,rmarkdown是1.3,RStudio是1.0.136,R是3.3.2。 - rmacey
2个回答

3
根据文档out.extra 提供了“图形的额外选项”。
如果我把 \FloatBarrier 放在代码块上面而不是使用 out.extra,我会得到更接近您想要的东西。
---
title: "Reproducible Error"
author: "Rex Macey"
date: "February 14, 2017"
output: pdf_document
header-includes: 
- \usepackage{placeins}
---

```{r setup, include=FALSE}
knitr::opts_chunk$set(echo = TRUE)
```

\newpage  

\FloatBarrier

# Section 1  
```{r CompTables, echo=FALSE, warning=FALSE, results='asis'}
comptables1<-matrix(rep(c(100,200,300,400,500),3),nrow=5,ncol=3)
colnames(comptables1)<-c("Conservative","Moderate","Aggressive")
row.names(comptables1)<-c("5th %-tile","25th %-tile","50th %-tile","75th %-tile","95th %-tile")
comptables2<-matrix(0,nrow=6,ncol=3)
comptables2[1,]<-comptables1[1,]
for (i in 2:5){
    comptables2[i,]<-comptables1[i,]-comptables1[i-1,]
}
comptables<-list()
comptables[[1]]<-list(comptables1,comptables2)
comptables[[2]]<-list(comptables1,comptables2)
comptables[[3]]<-list(comptables1,comptables2)
comptables[[4]]<-list(comptables1,comptables2)

knitr::kable(comptables[[1]][1],
         caption="Table of Forecast Wealth Values: Suggested One Year",
        format.args=list(big.mark=",",floating=FALSE))

knitr::kable(comptables[[2]][1],
         caption="Table of Forecast Wealth Values: Suggested Three Years",
        format.args=list(big.mark=",",floating=FALSE))

knitr::kable(comptables[[3]][1],
         caption="Table of Forecast Wealth Values: Suggested Five Years",
        format.args=list(big.mark=",",floating=FALSE))

knitr::kable(comptables[[4]][1],
         caption="Table of Forecast Wealth Values: Suggested Ten Years",
        format.args=list(big.mark=",",floating=FALSE))
```


```{r CompChart, echo=FALSE, warning=FALSE, fig.height=4, fig.show='hold', results='asis'}
horizons <- c(1,3,5,10)
par(mfrow=c(1,2))
minv<-min(unlist(comptables[[1]][1]),unlist(comptables[[2]][1]),
          unlist(comptables[[3]][1]),unlist(comptables[[4]][1]))
maxv<-max(unlist(comptables[[1]][1]),unlist(comptables[[2]][1]),
          unlist(comptables[[3]][1]),unlist(comptables[[4]][1]))
for (h in 1:length(horizons)){
    wealth.pl.comp<-matrix(unlist(comptables[[h]][2],use.names = FALSE),ncol=3,byrow=FALSE)
    colnames(wealth.pl.comp)<-c("Cons.","Mod.","Aggr.")
    barplot(wealth.pl.comp,col=c("white","red","yellow","green","blue"),border=NA,
        main=paste("Forecast A/T Values -",horizons[h],"Years"),
        ylim=c(minv/2,maxv+minv/2))
    abline(h=250,col="darkgray")
}
par(mfrow=c(1,1))
```


\newpage    

#Section 2

感谢您的帮助。您回复的速度让我惊叹。您的建议确实产生了不同的结果。我原本希望得到4个表格,然后是一个2x2网格中的4个图表。现在我得到了一个1x2行的图表,接着是4个表格,然后是下面的2个图表。添加另一个\FloatBarrier似乎可以解决问题。 - rmacey

2

有点晚回复,但我刚刚在处理这个问题。加载 kableExtra 包并在 kable_styling 选项中包含一些限制似乎可以解决问题。特别是 latex_options = c("hold_position")

---
title: "Reproducible Error"
author: "Rex Macey"
date: "February 14, 2017"
output: pdf_document
header-includes: 
    - \usepackage{placeins}
---

```{r setup, include=FALSE}
library("knitr")
library("tidyverse")
library("kableExtra")

knitr::opts_chunk$set(echo = TRUE)
```

\newpage  

# Section 1  
```{r CompTables, echo=FALSE, warning=FALSE, results='asis', out.extra='FloatBarrier'}
comptables1<-matrix(rep(c(100,200,300,400,500),3),nrow=5,ncol=3)
colnames(comptables1)<-c("Conservative","Moderate","Aggressive")
row.names(comptables1)<-c("5th %-tile","25th %-tile","50th %-tile","75th %-tile","95th %-tile")
comptables2<-matrix(0,nrow=6,ncol=3)
comptables2[1,]<-comptables1[1,]
for (i in 2:5){
    comptables2[i,]<-comptables1[i,]-comptables1[i-1,]
}
comptables<-list()
comptables[[1]]<-list(comptables1,comptables2)
comptables[[2]]<-list(comptables1,comptables2)
comptables[[3]]<-list(comptables1,comptables2)
comptables[[4]]<-list(comptables1,comptables2)

knitr::kable(comptables[[1]][1],
             caption="Table of Forecast Wealth Values: Suggested One Year",
             format.args=list(big.mark=",",floating=FALSE)) %>%
   kable_styling(c("bordered","condensed"),
                latex_options = c("hold_position"), 
                font_size = 10,
                full_width = F)


knitr::kable(comptables[[2]][1],
             caption="Table of Forecast Wealth Values: Suggested Three Years",
             format.args=list(big.mark=",",floating=FALSE))%>%
   kable_styling(c("bordered","condensed"),
                latex_options = c("hold_position"), 
                font_size = 10,
                full_width = F)

knitr::kable(comptables[[3]][1],
             caption="Table of Forecast Wealth Values: Suggested Five Years",
             format.args=list(big.mark=",",floating=FALSE))%>%
   kable_styling(c("bordered","condensed"),
                latex_options = c("hold_position"), 
                font_size = 10,
                full_width = F)

knitr::kable(comptables[[4]][1],
             caption="Table of Forecast Wealth Values: Suggested Ten Years",
             format.args=list(big.mark=",",floating=FALSE))%>%
   kable_styling(c("bordered","condensed"),
                latex_options = c("hold_position"), 
                font_size = 10,
                full_width = F)
```


```{r CompChart, echo=FALSE, warning=FALSE, fig.height=4, fig.show='hold', results='asis'}
horizons <- c(1,3,5,10)
par(mfrow=c(1,2))
minv<-min(unlist(comptables[[1]][1]),unlist(comptables[[2]][1]),
          unlist(comptables[[3]][1]),unlist(comptables[[4]][1]))
maxv<-max(unlist(comptables[[1]][1]),unlist(comptables[[2]][1]),
          unlist(comptables[[3]][1]),unlist(comptables[[4]][1]))
for (h in 1:length(horizons)){
    wealth.pl.comp<-matrix(unlist(comptables[[h]][2],use.names = FALSE),ncol=3,byrow=FALSE)
    colnames(wealth.pl.comp)<-c("Cons.","Mod.","Aggr.")
    barplot(wealth.pl.comp,col=c("white","red","yellow","green","blue"),border=NA,
            main=paste("Forecast A/T Values -",horizons[h],"Years"),
            ylim=c(minv/2,maxv+minv/2))
    abline(h=250,col="darkgray")
}
par(mfrow=c(1,1))
```


\newpage    

#Section 2

这将产生以下结果(来自PDF的截图): 标题页后的第2页 标题页后的第3页

网页内容由stack overflow 提供, 点击上面的
可以查看英文原文,
原文链接