1个回答
2
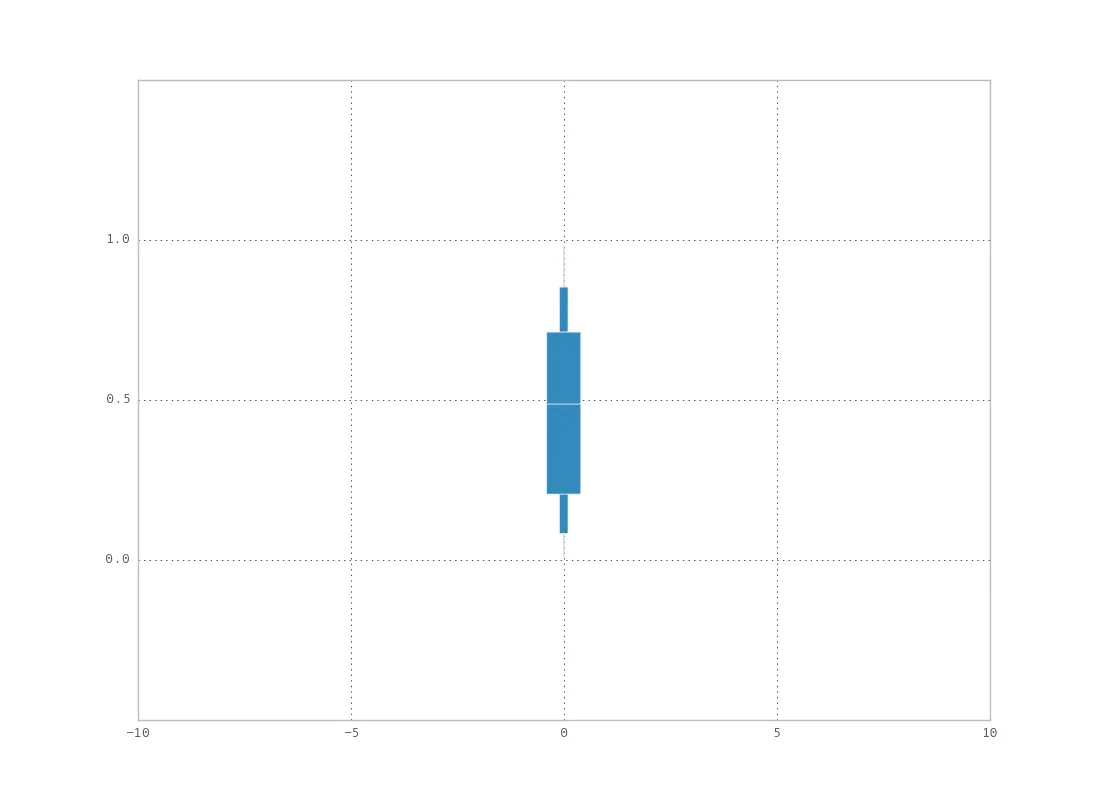
如果你还感兴趣,我已经准备了一个示例。它使用scipy.stats.scoreatpercentile,但你可能从其他地方获取这些数字:
from random import random
import numpy as np
import matplotlib.pyplot as plt
from scipy.stats import scoreatpercentile

x = np.array([random() for x in xrange(100)])

# percentiles of interest
perc = [min(x), scoreatpercentile(x,10), scoreatpercentile(x,25),
               scoreatpercentile(x,50), scoreatpercentile(x,75),
               scoreatpercentile(x,90), max(x)]
midpoint = 0 # time-series time

fig = plt.figure()
ax = fig.add_subplot(111)
# min/max
ax.broken_barh([(midpoint-.01,.02)], (perc[0], perc[1]-perc[0]))
ax.broken_barh([(midpoint-.01,.02)], (perc[5], perc[6]-perc[5]))
# 10/90
ax.broken_barh([(midpoint-.1,.2)], (perc[1], perc[2]-perc[1]))
ax.broken_barh([(midpoint-.1,.2)], (perc[4], perc[5]-perc[4]))
# 25/75
ax.broken_barh([(midpoint-.4,.8)], (perc[2], perc[3]-perc[2]))
ax.broken_barh([(midpoint-.4,.8)], (perc[3], perc[4]-perc[3]))

ax.set_ylim(-0.5,1.5)
ax.set_xlim(-10,10)
ax.set_yticks([0,0.5,1])
ax.grid(True)
plt.show()
- maxm
网页内容由stack overflow 提供, 点击上面的可以查看英文原文,
原文链接
原文链接
broken_barh自己完成。 - aganders3