我们可以使用训练集分布来可视化决策树,例如。
from matplotlib import pyplot as plt
from sklearn import datasets
from sklearn.tree import DecisionTreeClassifier
from sklearn import tree

# Prepare the data data, can do row sample and column sample here
iris = datasets.load_iris()
X = iris.data
y = iris.target
# Fit the classifier with default hyper-parameters
clf = DecisionTreeClassifier(random_state=1234)
clf.fit(X, y)


fig = plt.figure(figsize=(25,20))
_ = tree.plot_tree(clf,
                   feature_names=iris.feature_names,
                   class_names=iris.target_names,
                   filled=True)
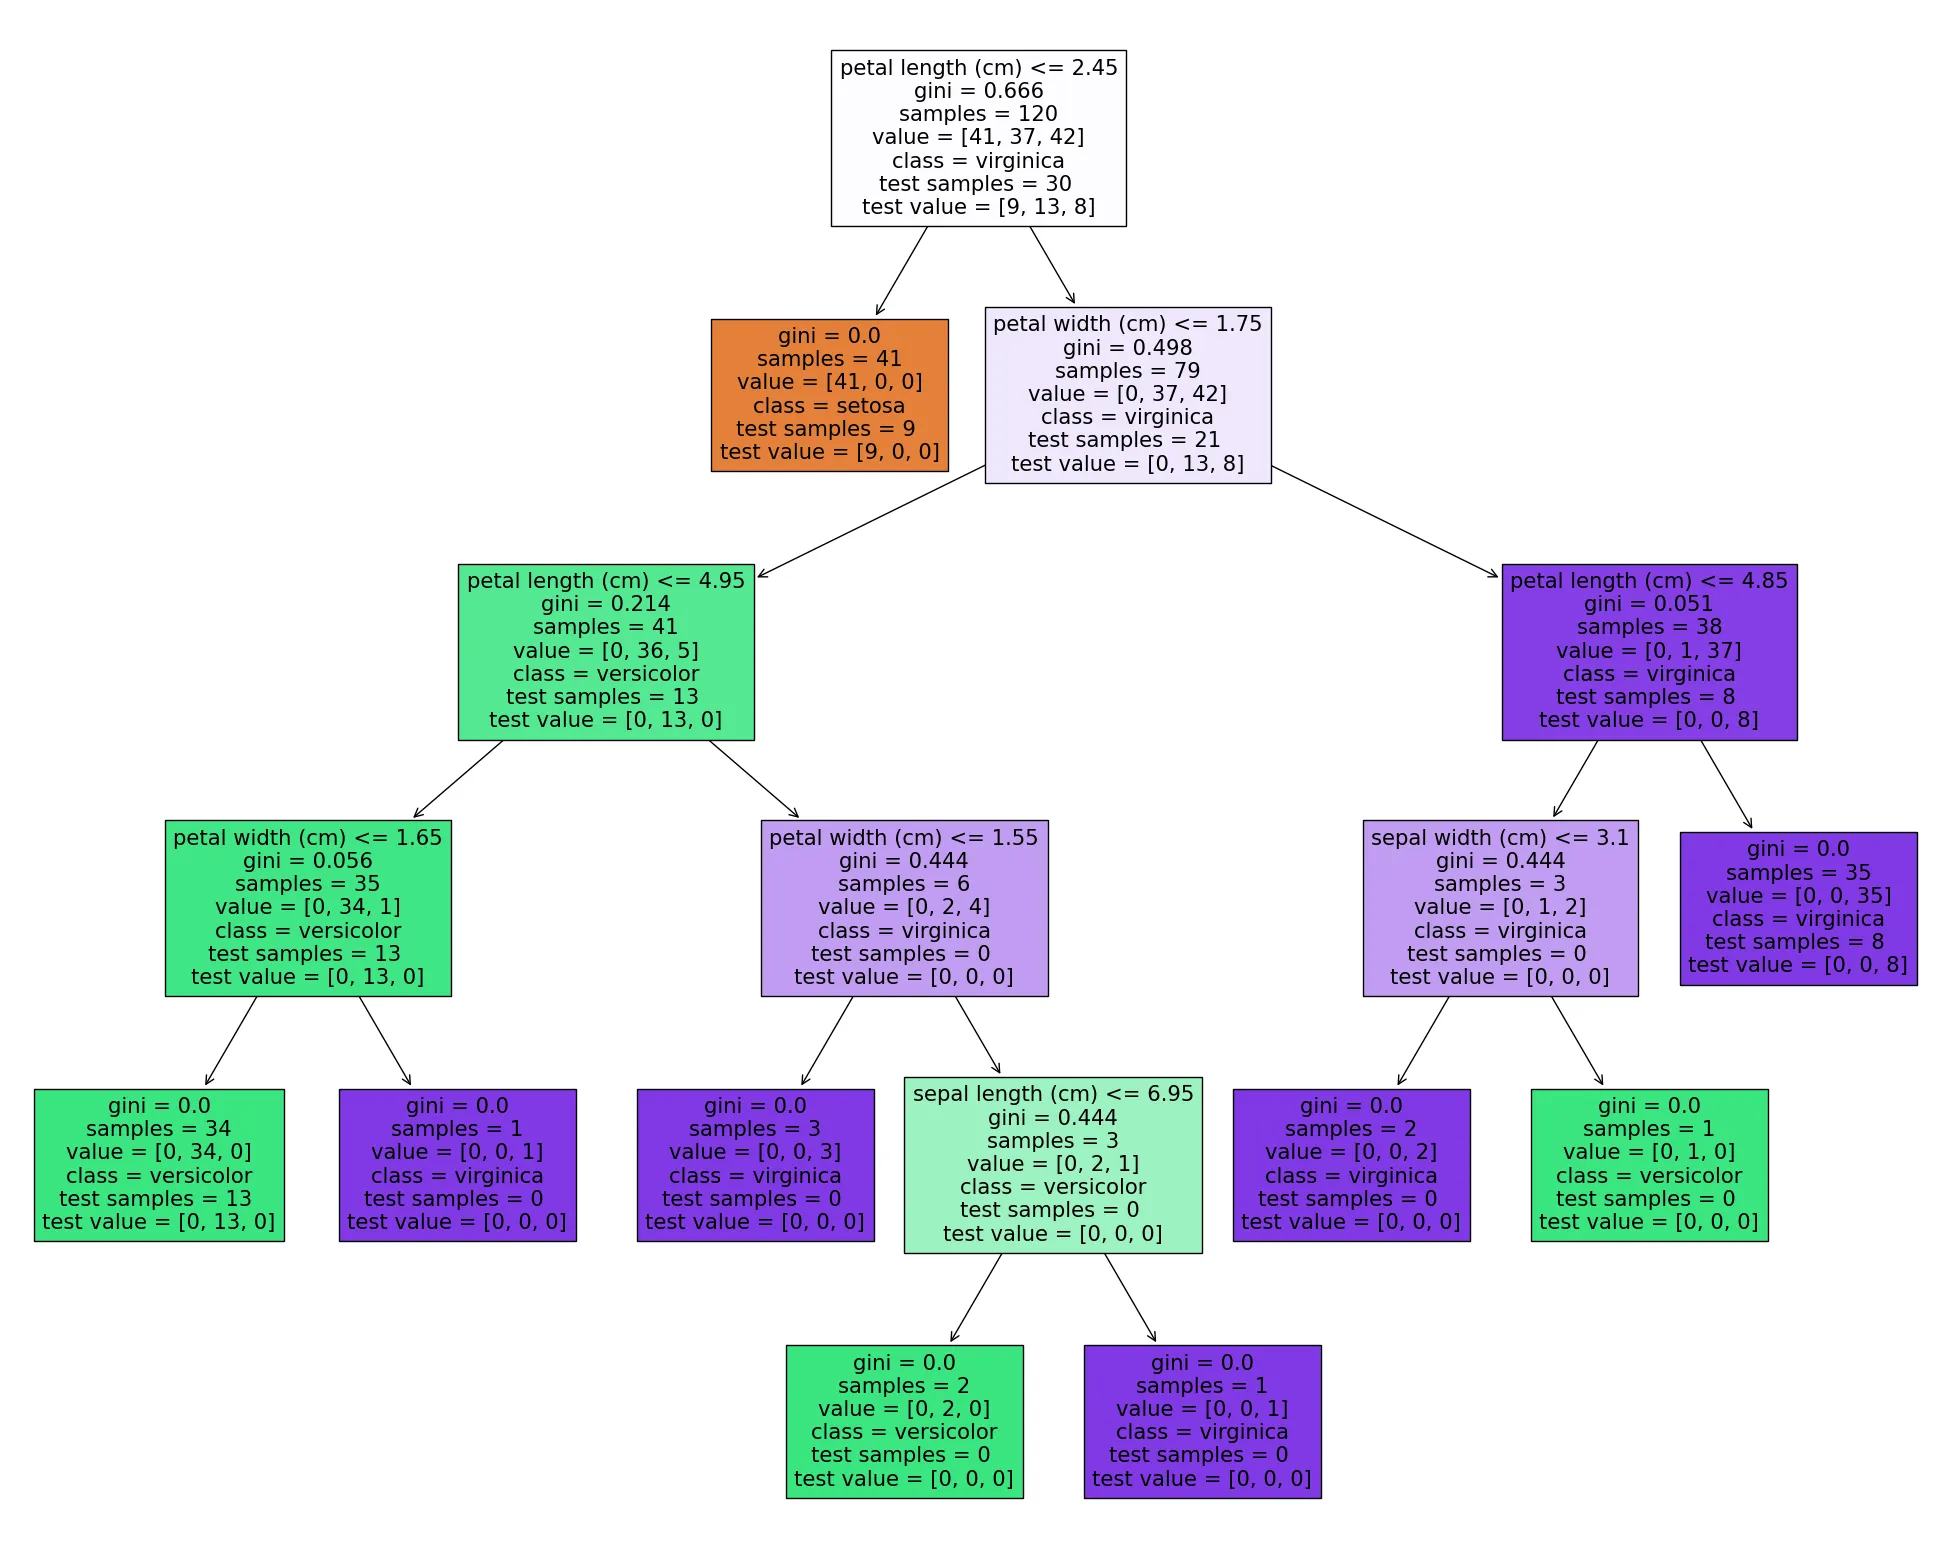
让我们通过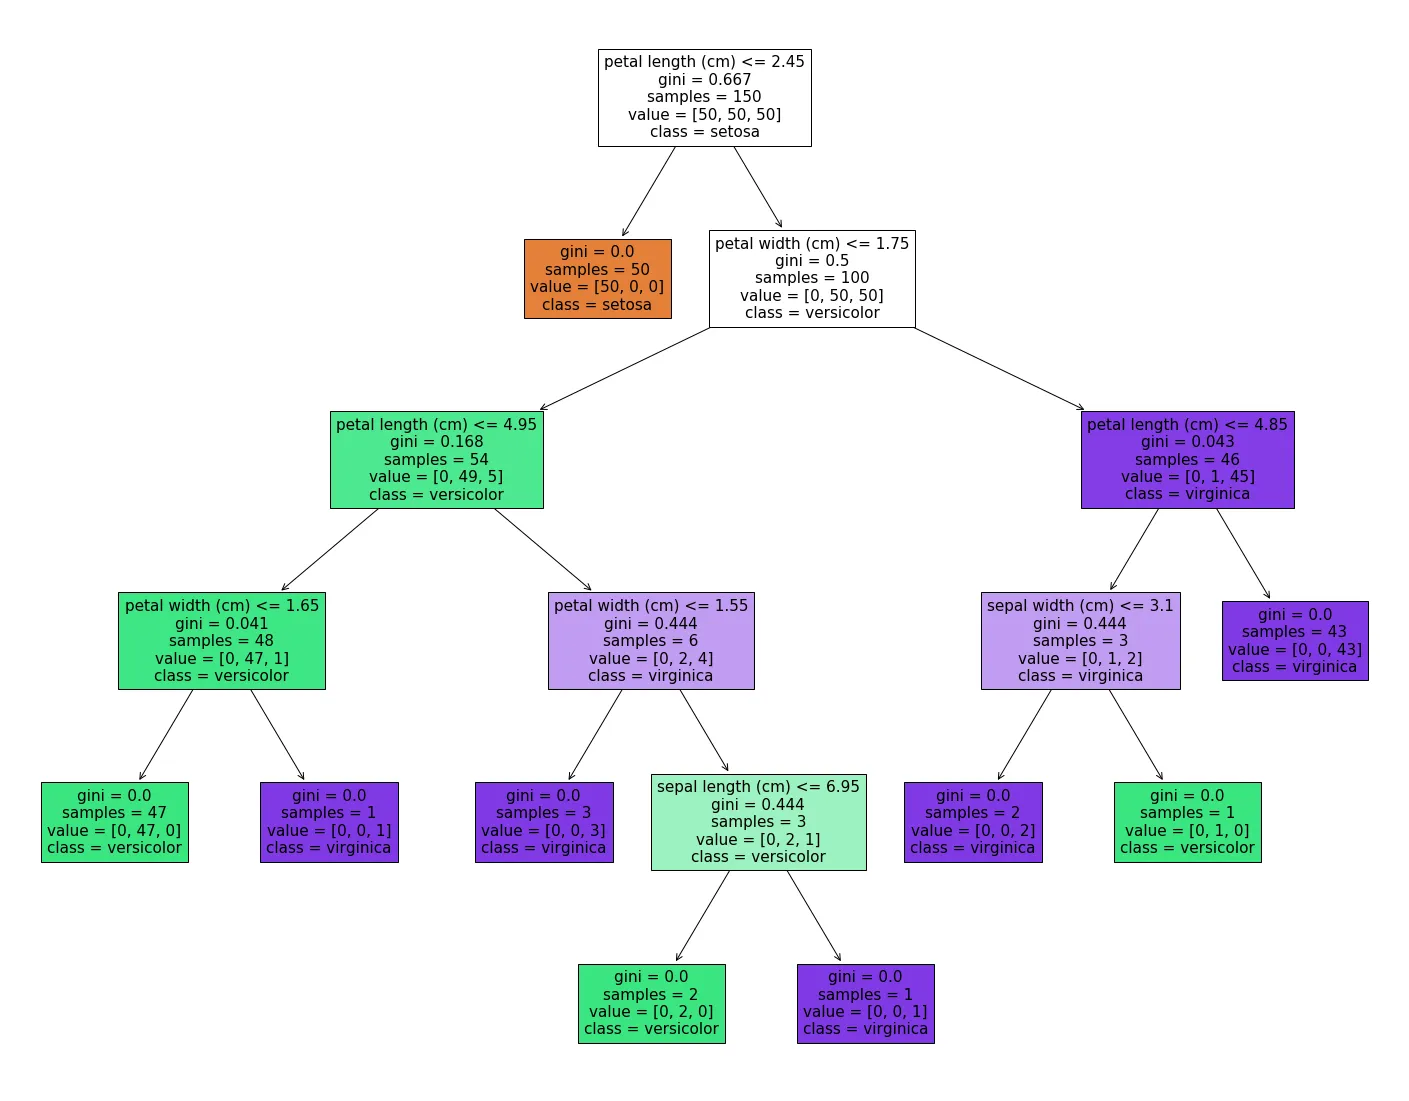 来了解训练集的分布情况,例如根节点中
value = [50, 50, 50]。
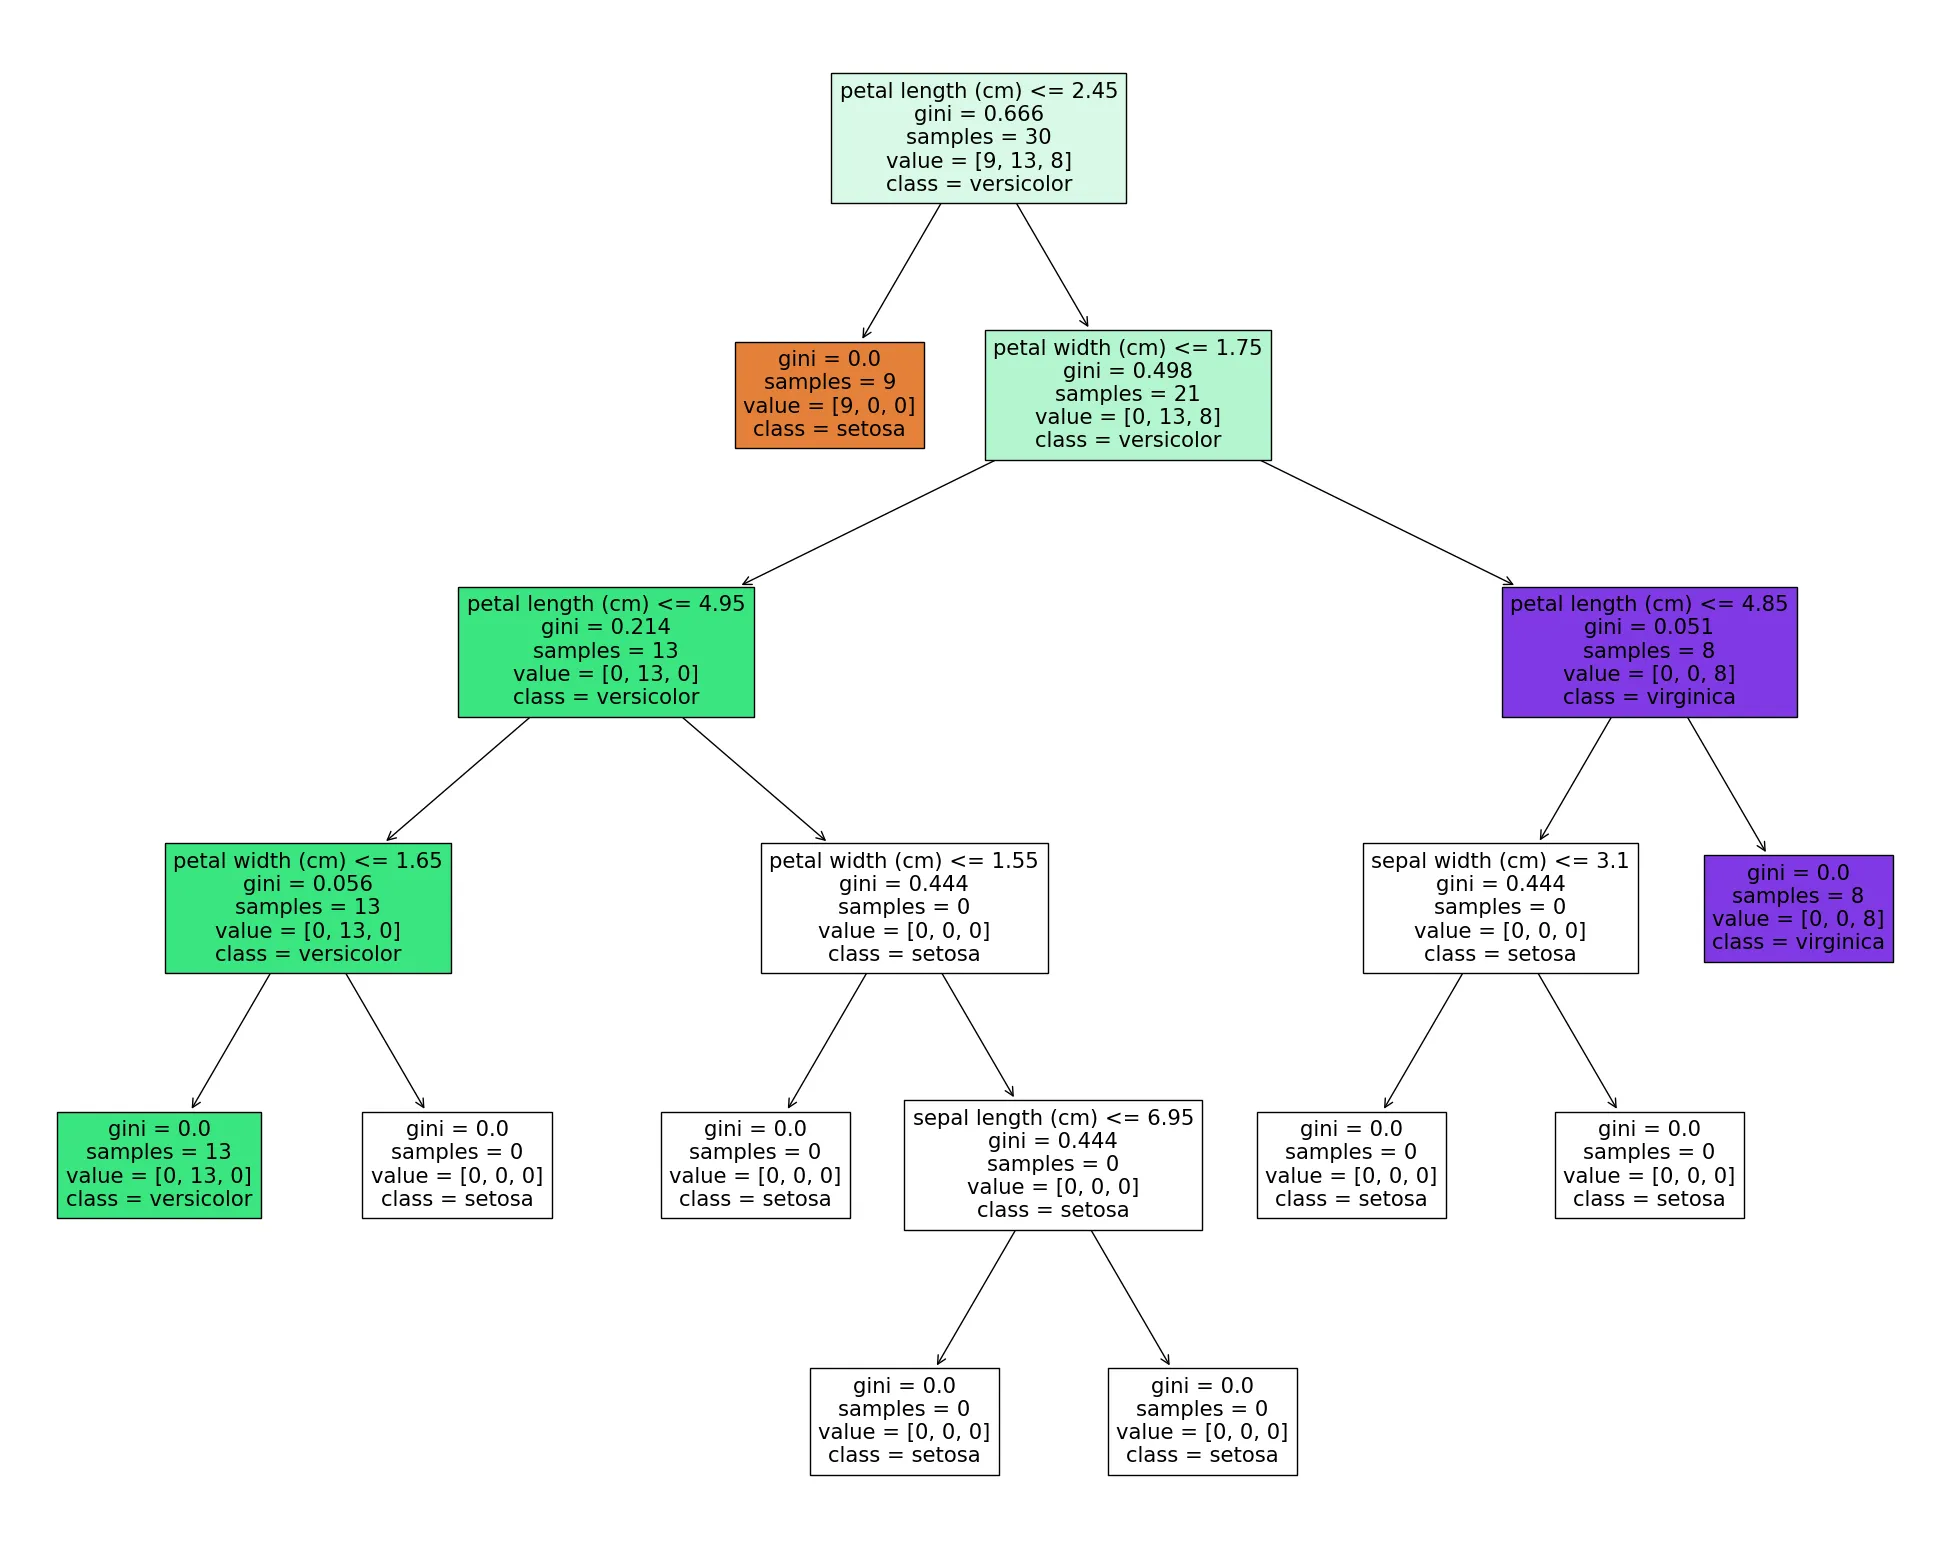
然而,我无法为其提供测试集,并在可视化树中获得测试集的分布情况。