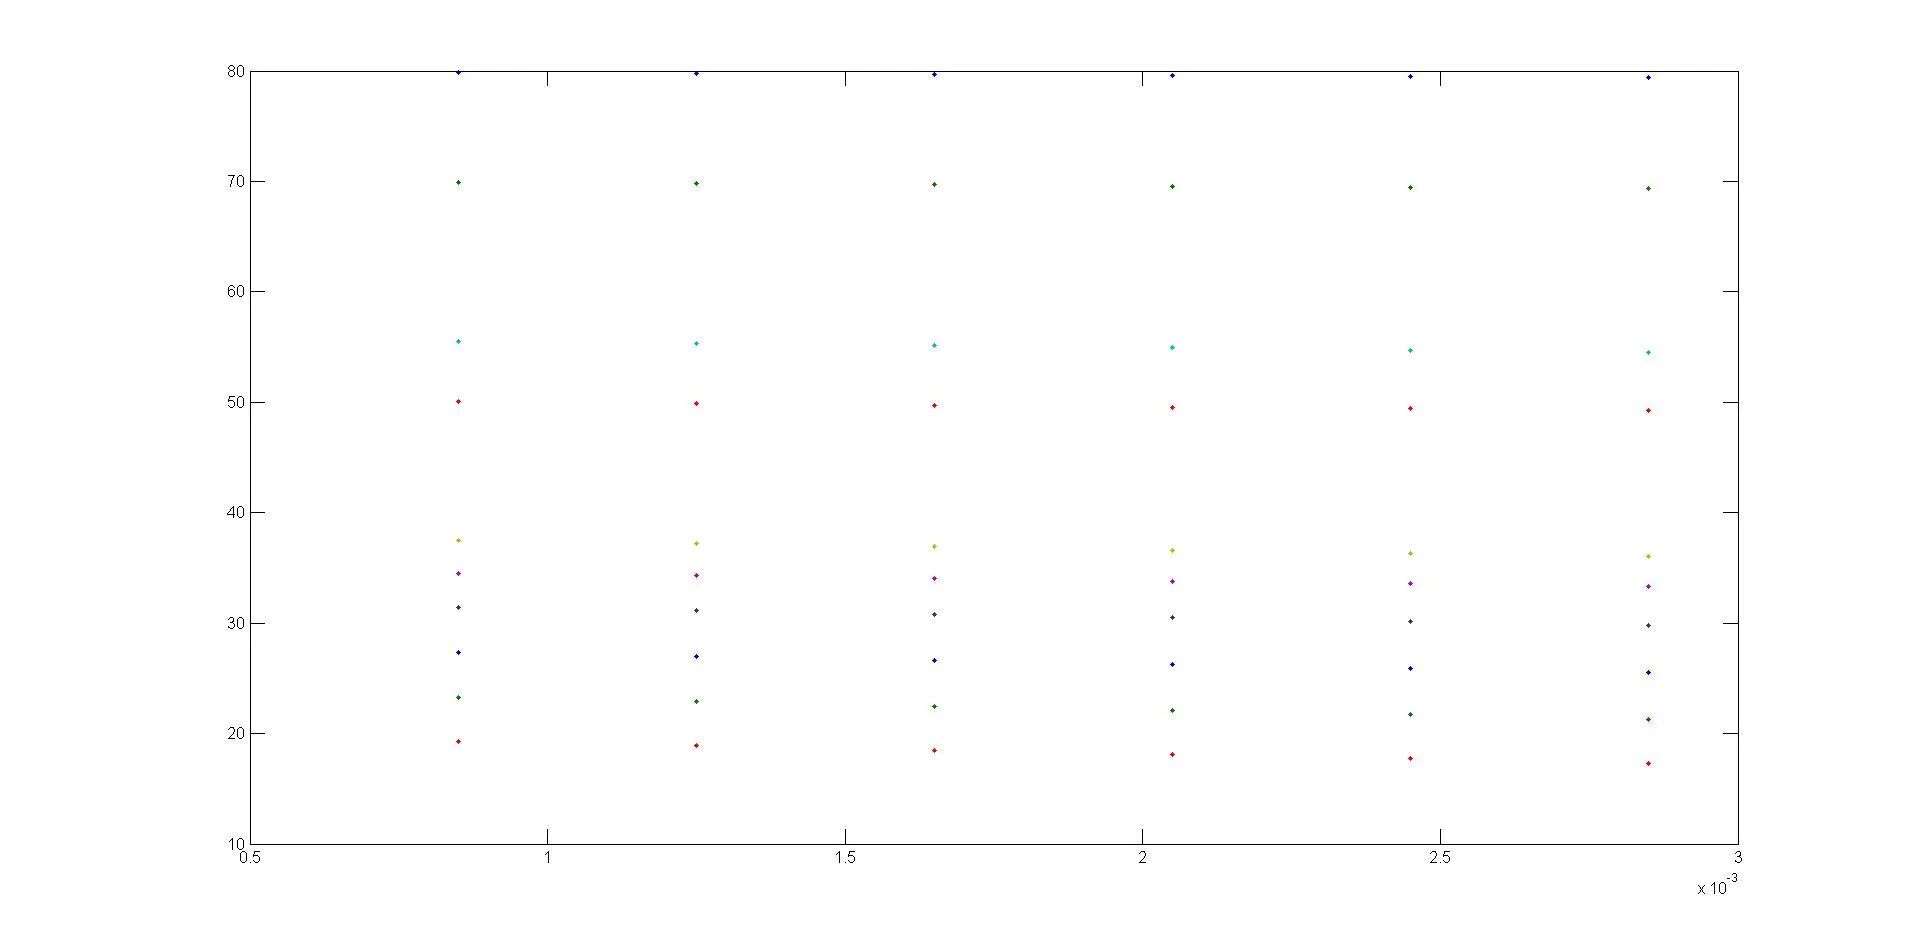
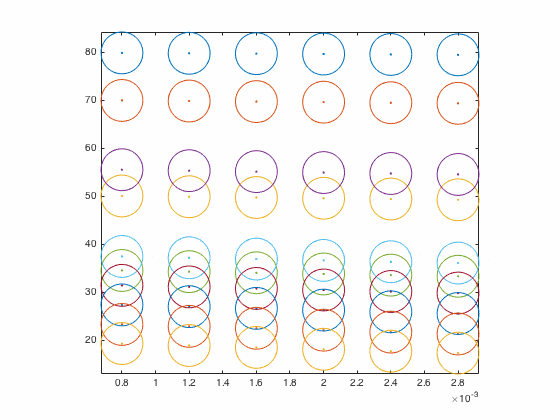
我有两个矩阵
timeline = [0.0008 0.0012 0.0016 0.0020 0.0024 0.0028];
Origdata =
   79.8400   69.9390   50.0410   55.5082   34.5200   37.4486   31.4237   27.3532   23.2860   19.3039
   79.7600   69.8193   49.8822   55.3115   34.2800   37.1730   31.1044   26.9942   22.8876   18.9061
   79.6800   69.6996   49.7233   55.1148   34.0400   36.8975   30.7850   26.6352   22.4891   18.5084
   79.6000   69.5799   49.5645   54.9181   33.8000   36.6221   30.4657   26.2762   22.0907   18.1108
   79.5200   69.4602   49.4057   54.7215   33.5600   36.3467   30.1464   25.9173   21.6924   17.7133
   79.4400   69.3405   49.2469   54.5249   33.3200   36.0714   29.8271   25.5584   21.2941   17.3159
当我将它们绘制出来时,我得到了下面这样的图表。
plot(timeline, Origdata, '.');
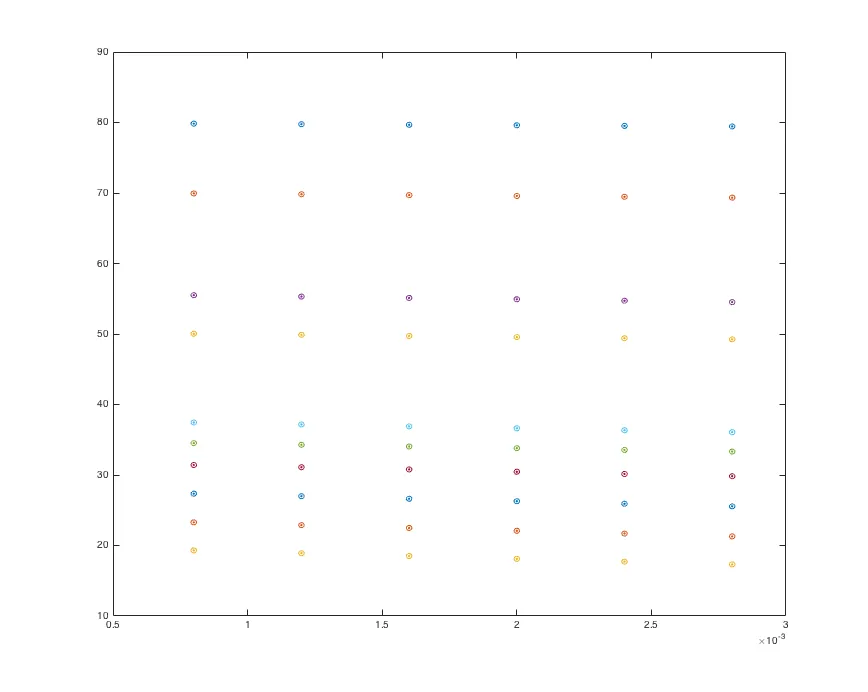
如何在每个点周围绘制一个半径为0.3524的圆?该半径应仅相对于y轴。
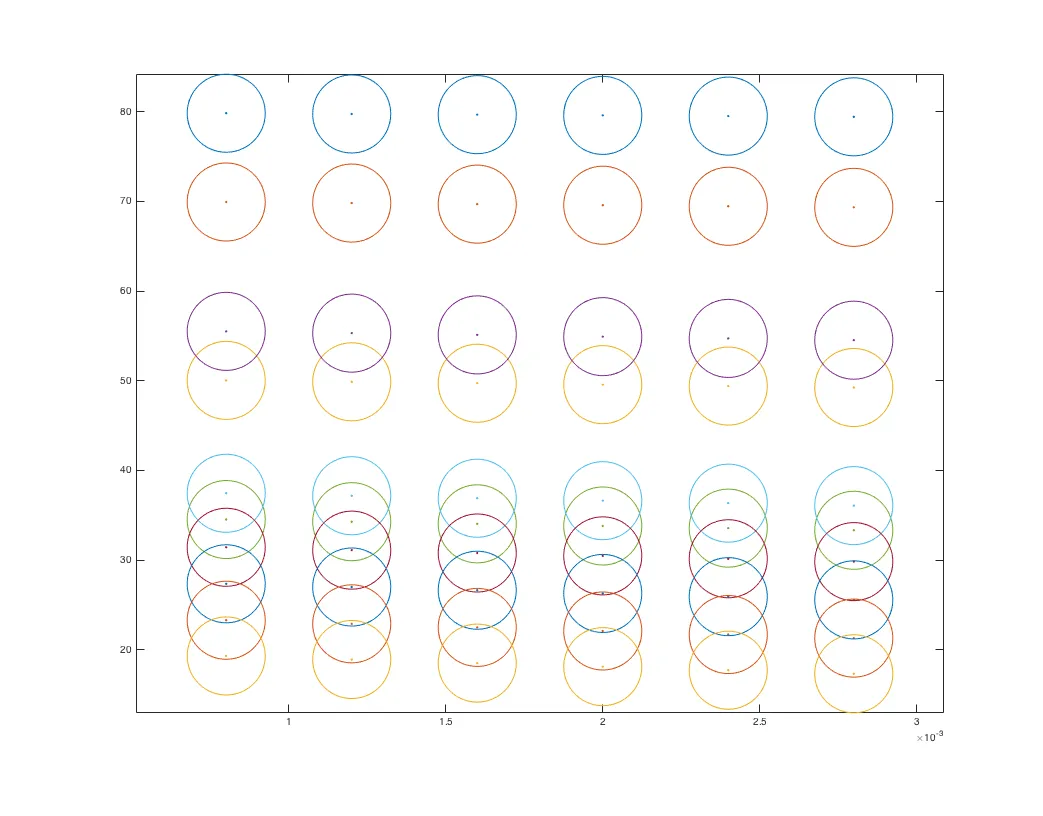
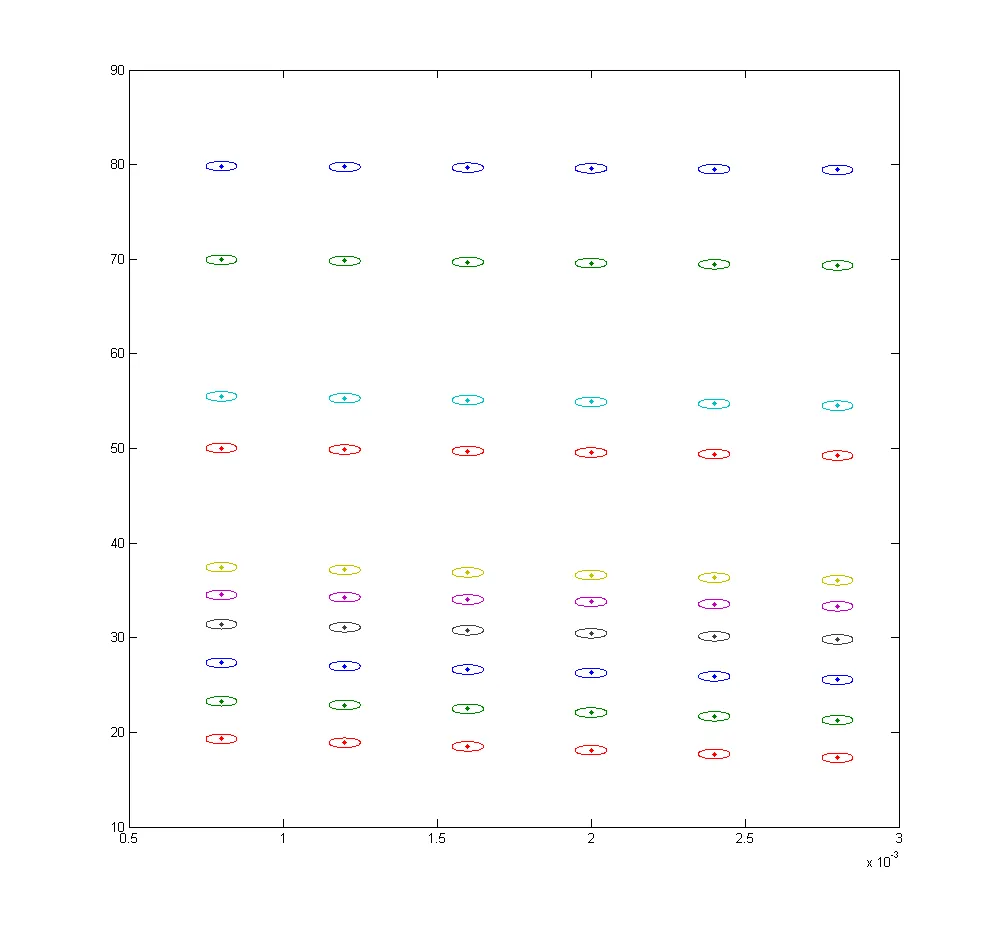
errorbar(repmat(timeline.',1,size(Orgidata,2)),Orgidata,0.3524*ones(size(Orgidata)),'.')- Daniel