我正在使用以下代码绘制两条线:
plot(x, y, type = "l", color = "red")
并且
points(x2, y2, type = "l", color = "blue")
我希望能够在每一行旁边添加一个标签(而不是图例)。 我相信可以使用http://directlabels.r-forge.r-project.org/包来实现。
然而,我没有找到一个简单的方法来做到这一点。
我正在使用以下代码绘制两条线:
plot(x, y, type = "l", color = "red")
并且
points(x2, y2, type = "l", color = "blue")
我希望能够在每一行旁边添加一个标签(而不是图例)。 我相信可以使用http://directlabels.r-forge.r-project.org/包来实现。
然而,我没有找到一个简单的方法来做到这一点。
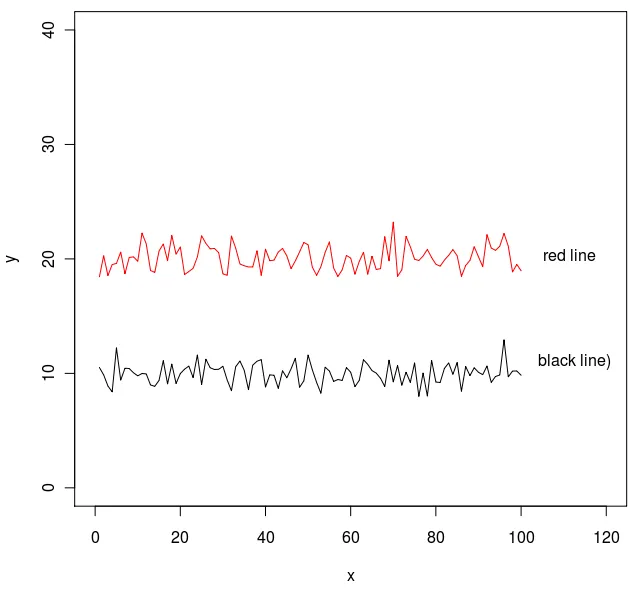
您可以使用点&点击方法在 text() 中使用 locator()。
y <- rnorm(100, 10)
y2 <- rnorm(100, 20)
x <- 1:100

plot(x, y, type = "n", ylim = c(0, 40), xlim = c(0, 120))
lines(x, y)
lines(x, y2, col = "red")
text(locator(), labels = c("red line", "black line)"))
你可以不使用locator()方法,而是将标签坐标作为数据函数的一部分。例如,在Roman的演示基础上:
text(x=rep(max(x)+3, 2), y=c(mean(y), mean(y2)), pos=4, labels=c('black line', 'red line'))
locator() 是一种交互式方法,通过点击现有的图形来获取坐标。
以下是如何使用locator()找到图形标签正确坐标的说明。
步骤1:绘制一个图形:
plot(1:100)
第二步:在控制台中输入以下内容:
coords <- locator()
第三步: 在图表上点击一次,然后在图表左上角点击Stop .. Stop Locator(这将控制权返回到R控制台)。
第四步: 查找返回的坐标:
coords
$x
[1] 30.26407
$y
[1] 81.66773
text(x=30.26407, y=81.66773,label="This label appears where I clicked")
或者
text(x=coords$x, y=coords$y,label="This label appears where I clicked")
text的帮助文档,并添加参数pos=4。text(x=30,y=80,pos=4,label = "hello")
注释:
legend()来绘制标签(这会在标签周围绘制一个框,看起来更漂亮)。ggplot2而不是plot,因为ggplot2是生成图形的黄金标准。y <- rnorm(100, 10)
y2 <- rnorm(100, 20)
x <- 1:100
treatment <- rep(c("one group","another"),each=length(x))
df <- data.frame(x=c(x,x),y=c(y,y2),treatment)
library(lattice)
p <- xyplot(y~x,df,groups=treatment,type="l")
if(!require(directlabels)){
install.packages("directlabels")
library(directlabels)
}
print(direct.label(p))
print(direct.label(update(p,xlim=c(0,120)),last.points))
pos应该被适当地设置。 - Nick Dong