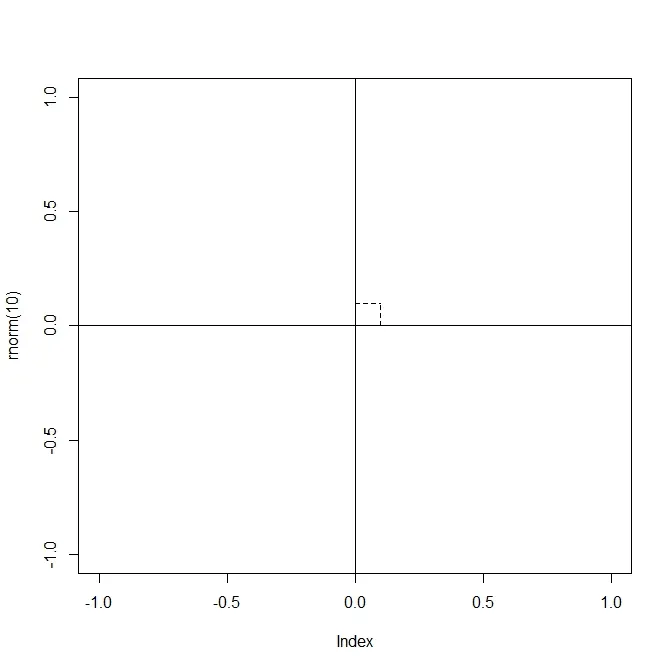
众所周知,我们会使用两条点线来表示两条线垂直(如图所示)。
是否有任何参数来表示此符号,例如symbol="perpendicular"?
到目前为止,我手动绘制此符号,如下面的代码所示。
plot(rnorm(10),type="n",xlim=c(-1,1),ylim=c(-1,1))
abline(h=0,v=0)
lines(c(0,0.1),c(0.1,0.1),lty=2)
lines(c(0.1,0.1),c(0,0.1),lty=2)
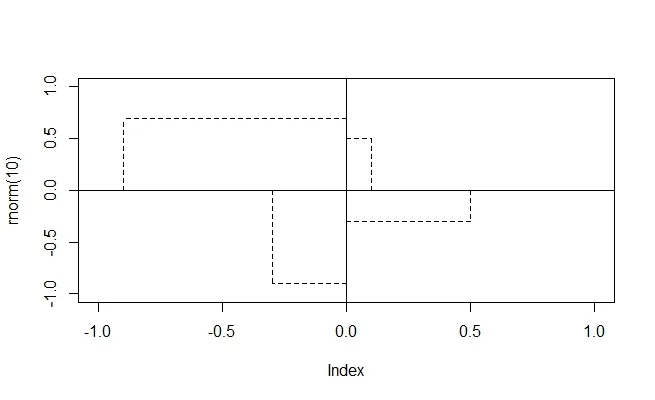
自定义函数:
#Cutom function
myfunction <- function(x, y){
  for(i in seq_along(x)){
    lines(c(x[i], x[i]), c(0,y[i]), lty = 2)
    lines(c(0, x[i]), c(y[i], y[i]), lty = 2)
    }
  }


plot(rnorm(10), type="n", xlim = c(-1,1), ylim = c(-1,1))
abline(h = 0, v = 0)

myfunction(x = c(0.1,  0.5, -0.3, -0.9),
           y = c(0.5, -0.3, -0.9,  0.7))
首先,感谢zx8754的回答。我喜欢使用自定义函数的想法。然而,在我的实际情况中,这两条线不是平行于x轴和y轴的。因此,我写了另一个自定义函数,称为perpendicular。顺便说一下,任何建议都将不胜感激。以下是代码和结果:
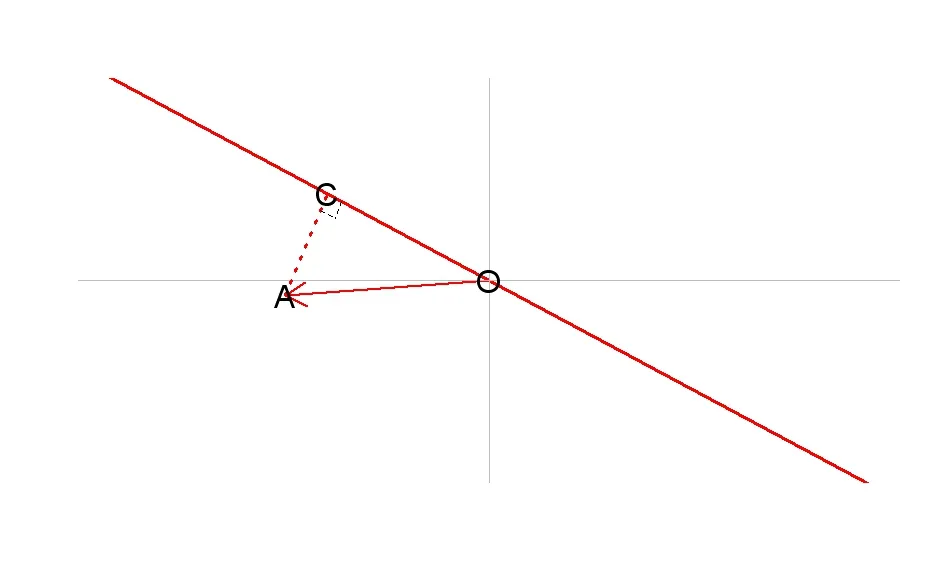
# Make an axuliarry  line,perpendicular, from A to line OC
plot(rnorm(1),xlim=c(-7,7),ylim=c(-3,3),type="n",las=1,axes=F,xlab="",ylab="")
abline(0,-7/15,col="red",lwd=3)
arrows(0,0,-15/4,-1/4,lwd=2,col="red")
arrows(0,0,18,0,col="gray");arrows(0,0,-9,0,col="gray")
arrows(0,0,0,10,col="gray");arrows(0,0,0,-9,col="gray")
lines(c(-15/4,-218*15/1096),c(-1/4,218*7/1096),col="red",lty=3,lwd=3)
text(-15/4,-1/4,"A",cex=2)
text(-218*15/1096,218*7/1096,"C",cex=2)
text(0,0,"O",cex=2)
#make an perpendicilar symbol to emphasis that it is perpendicular
perpendicular(-218*15/1096,218*7/1096,-15/4,-1/4,0,0,0.3)


# Given any three points,connected with two lines, perpendicualr function can draw an shape in the oppisite direction.
# Note: When two lines are perpendicular,the output will be an perpendicular symbol!
# Definition of notation:
# (x,y) is the turning points of the shape.
# (x1,y1) and (x2,y2) are the other two points.
# k is the length, depending on how large shape you want.

perpendicular<-function(x,y,x1,y1,x2,y2,k){
        #points(x,y,col="red",pch=16);points(x1,y1,pch=16);points(x2,y2,pch=16)
            m1<-c(x1-x,y1-y);m2<-c(x2-x,y2-y)   #two vector of the line
            m1<-m1/sqrt(sum(m1^2));m2<-m2/sqrt(sum(m2^2))   #standardlized the vector
            #construct the shape I want
            xx1<-c(x,y)+k*m1
            xx2<-c(x,y)+k*m2
            xx3<-c(x,y)+k*(m1+m2)
            lines(c(xx1[1],xx3[1]),c(xx1[2],xx3[2]),lty=2)
            lines(c(xx2[1],xx3[1]),c(xx2[2],xx3[2]),lty=2)
            }
⊥- 是垂直符号 - zx8754