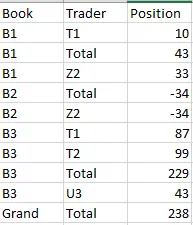
如何自定义排序pandas多级索引?

3
以下代码生成名为out的pandas表格。
import pandas as pd 
import numpy as np

df = pd.DataFrame({'Book': ['B1', 'B1', 'B2', 'B3', 'B3', 'B3'], 
                   'Trader': ['T1', 'Z2', 'Z2', 'T1', 'U3', 'T2'], 
                   'Position':[10, 33, -34, 87, 43, 99]})
df = df[['Book', 'Trader', 'Position']]

table = pd.pivot_table(df, index=['Book', 'Trader'], values=['Position'], aggfunc=np.sum)

print(table)

tab_tots = table.groupby(level='Book').sum()
tab_tots.index = [tab_tots.index, ['Total'] * len(tab_tots)]
print(tab_tots)

out = pd.concat(
    [table, tab_tots]
).sort_index().append(
    table.sum().rename(('Grand', 'Total'))
)
outthis.
的表格如图所示:

但我希望它看起来像这样:this.

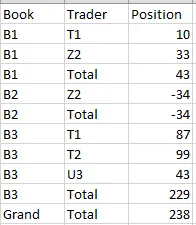
请注意,第二个表格总是将“Total”放在底部。 因此,基本上我仍然想按字母顺序排序,但我想始终将“Total”放在最后。 有人能提供一些代码调整以获得我想要的输出吗?

2个回答

2
Pandas内置了pivot_table函数,可以计算边际总数。
table = pd.pivot_table(df, 
               index='Book', 
               columns='Trader', 
               values='Position', 
               aggfunc=np.sum, 
               margins=True, 
               margins_name='Total').drop('Total').stack()
table[('Grand', 'Total')] = table.sum()
table.name = 'Position'
table.reset_index()

     Book Trader  Position
0      B1     T1      10.0
1      B1     Z2      33.0
2      B1  Total      43.0
3      B2     Z2     -34.0
4      B2  Total     -34.0
5      B3     T1      87.0
6      B3     T2      99.0
7      B3     U3      43.0
8      B3  Total     229.0
13  Grand  Total     238.0

基于多索引排序的解决方案

该解决方案从您的分析中继续,从您的out DataFrame开始。您可以将BookTrader转换为Pandas分类类型,通过传入参数ordered=True和一个按照您想要排序的顺序列出的categories列表来实现自定义排序。

out = out.reset_index()

trader_cats = pd.Categorical(out['Trader'], 
                   categories=sorted(df.Trader.unique()) + ['Total'], 
                   ordered=True)

book_cats = pd.Categorical(out['Book'], 
                   categories=sorted(df.Book.unique()) + ['Grand'], 
                   ordered=True)

out['Trader'] = trader_cats
out['Book'] = book_cats
out.set_index(['Book', 'Trader'], inplace=True)
out.sort_index(level=['Book', 'Trader'])

              Position
Book  Trader          
B1    T1            10
      Z2            33
      Total         43
B2    Z2           -34
      Total        -34
B3    T1            87
      T2            99
      U3            43
      Total        229
Grand Total        238

1
你可以使用 groupbyunstack 进行重塑。然后轻松添加新的 Total 列,计算 Grand Total 并进行 stack。最后通过 loc 添加新行:
df1 = df.groupby(['Book','Trader']).Position.sum().unstack()
df1['Total'] = df1.sum(1)
all_sum = df1['Total'].sum()
df1 = df1.stack()
df1.loc[('Grand','Total')] = all_sum
df1 = df1.reset_index(name='Position')
print (df1)
    Book Trader  Position
0     B1     T1      10.0
1     B1     Z2      33.0
2     B1  Total      43.0
3     B2     Z2     -34.0
4     B2  Total     -34.0
5     B3     T1      87.0
6     B3     T2      99.0
7     B3     U3      43.0
8     B3  Total     229.0
9  Grand  Total     238.0

与另一种解决方案相比:
def jez(df):
    df1 = df.groupby(['Book','Trader']).Position.sum().unstack()
    df1['Total'] = df1.sum(1)
    all_sum = df1['Total'].sum()
    df1 = df1.stack()
    df1.loc[('Grand','Total')] = all_sum
    df1 = df1.reset_index(name='Position')
    return (df1)


def ted1(df):
    table = pd.pivot_table(df, 
                           index=['Book'], 
                           columns=['Trader'], 
                           values=['Position'], 
                           aggfunc=np.sum, 
                           margins=True, 
                           margins_name='total')
    return table.stack()\
                  .rename({'total':'Total'})\
                  .reset_index(1)\
                  .rename({'Total':'Grand'})\
                  .reset_index()\
                  .query('Book != "Grand" | Trader == "Total"')


print (jez(df))
print (ted1(df))

In [419]: %timeit (jez(df))
100 loops, best of 3: 5.65 ms per loop

In [420]: %timeit (ted1(df))
10 loops, best of 3: 26.5 ms per loop

结论:
对于小计,groupby+unstack 解决方案更快,同时也更容易得到小计的 sumpivot_table 更易于透视(只需一个函数),但在小计和总计行的操作上更复杂。

网页内容由stack overflow 提供, 点击上面的
可以查看英文原文,
原文链接