我该如何将ggplot2图例移到绘图底部并将其水平显示?
示例代码:
library(reshape2) # for melt
df <- melt(outer(1:4, 1:4), varnames = c("X1", "X2"))
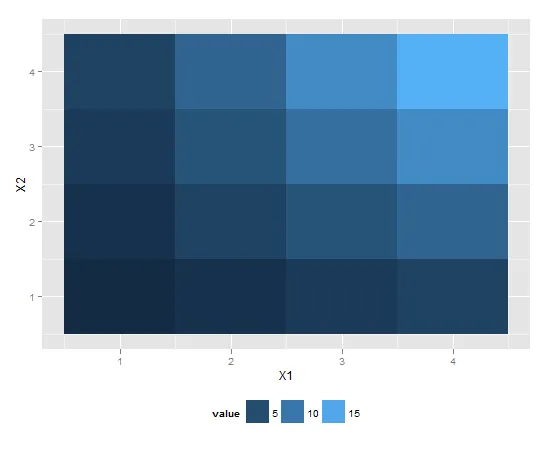
p1 <- ggplot(df, aes(X1, X2)) + geom_tile(aes(fill = value))
p1 + scale_fill_continuous(guide = guide_legend())
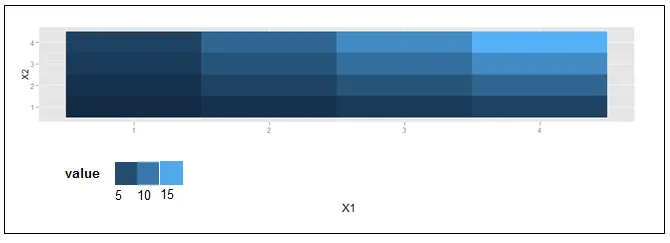
期望的(大致)结果:
我该如何将ggplot2图例移到绘图底部并将其水平显示?
示例代码:
library(reshape2) # for melt
df <- melt(outer(1:4, 1:4), varnames = c("X1", "X2"))
p1 <- ggplot(df, aes(X1, X2)) + geom_tile(aes(fill = value))
p1 + scale_fill_continuous(guide = guide_legend())
期望的(大致)结果:
如果您想移动图例的位置,请使用以下代码:
library(reshape2) # for melt
df <- melt(outer(1:4, 1:4), varnames = c("X1", "X2"))
p1 <- ggplot(df, aes(X1, X2)) + geom_tile(aes(fill = value))
p1 + scale_fill_continuous(guide = guide_legend()) +
    theme(legend.position="bottom")
ggplot会出现警告:'opts'已经被弃用,请使用'theme'代替。(已弃用;最后一次使用版本为0.9.1)。将opts替换为theme即可解决问题。 - krlmlrggplot的内部工作方式会发生变化。 - Shreyas Karnik+ theme(legend.position='bottom') - Omar Wagihggplot2 图例项之间的间距问题:https://dev59.com/KKzka4cB1Zd3GeqP4zRP#50885122 https://dev59.com/xJ_ha4cB1Zd3GeqPyGd8 https://dev59.com/La3la4cB1Zd3GeqPOYuz https://dev59.com/bloT5IYBdhLWcg3wlgXn。 - Arthur Yip这是创建所需结果的方法:
library(reshape2); library(tidyverse)
melt(outer(1:4, 1:4), varnames = c("X1", "X2")) %>%
ggplot() +
  geom_tile(aes(X1, X2, fill = value)) +
  scale_fill_continuous(guide = guide_legend()) +
  theme(legend.position="bottom",
        legend.spacing.x = unit(0, 'cm'))+
  guides(fill = guide_legend(label.position = "bottom"))

这段文字是由reprex package (v0.3.0)于2019年12月7日创建的。
编辑:这些不完美的选项不再需要了,但我会将它们留在这里供参考。
两个不完美的选项,虽然不能完全满足您的要求,但非常接近(至少能将颜色放在一起)。
library(reshape2); library(tidyverse)
df <- melt(outer(1:4, 1:4), varnames = c("X1", "X2"))
p1 <- ggplot(df, aes(X1, X2)) + geom_tile(aes(fill = value))
p1 + scale_fill_continuous(guide = guide_legend()) +
 theme(legend.position="bottom", legend.direction="vertical")

p1 + scale_fill_continuous(guide = "colorbar") + theme(legend.position="bottom")

这段内容是由reprex包 (v0.2.1)于2019-02-28创建的。