我希望我的图表看起来像这样(请注意图例的布局):
我已经尝试使用以下代码实现,但是图例并不完全相同。
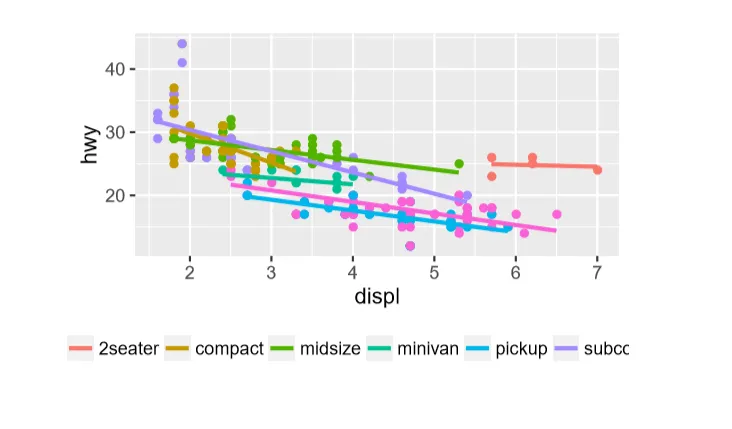
  ggplot(mpg, aes(displ, hwy, colour = class)) +
   geom_point() +
   geom_smooth(method = "lm", se = F) +
   theme(legend.position = "bottom", legend.box = "horizontal") +
   scale_color_discrete(NULL) +
   guides(fill = guide_legend(ncol = 1, nrow = 1, byrow = TRUE))
