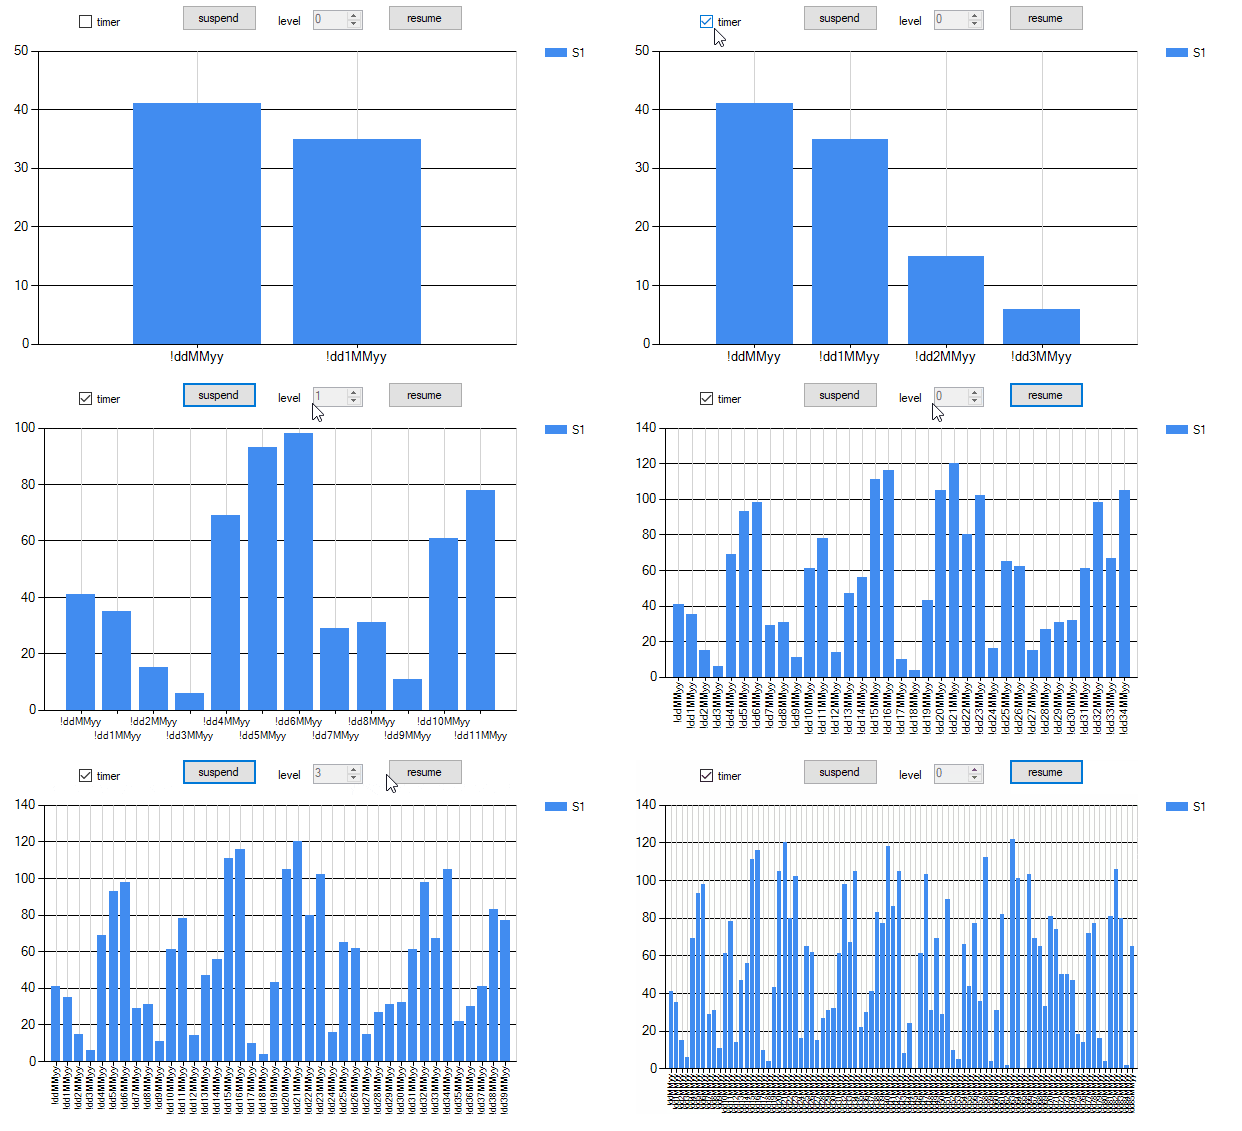
我希望可以在图表的系列更新中添加“暂停”功能,以便进行一些任务(例如,我有一个按钮,当我点击它时,将暂停图表更新,然后当我点击恢复按钮时,它将更新所有已暂停的系列点)。
我知道关于
我知道关于
chart1.Series.SuspendUpdates();
但是看起来对我不起作用。我使用mschart示例——实时数据(线程安全)。
下面是完整的代码:
public partial class RealTimeSample : Form
{
    public RealTimeSample()
    {
        InitializeComponent();
    }
    private Thread addDataRunner;
    private Random rand = new Random();

    public delegate void AddDataDelegate();
    public AddDataDelegate addDataDel;
    private void RealTimeSample_Load(object sender, System.EventArgs e)
    {

        // create the Adding Data Thread but do not start until start button clicked
        ThreadStart addDataThreadStart = new ThreadStart(AddDataThreadLoop);
        addDataRunner = new Thread(addDataThreadStart);

        // create a delegate for adding data
        addDataDel += new AddDataDelegate(AddData);

    }


    /// Main loop for the thread that adds data to the chart.
    /// The main purpose of this function is to Invoke AddData
    /// function every 1000ms (1 second).
    private void AddDataThreadLoop()
    {
        while (true)
        {
            chart1.Invoke(addDataDel);

            Thread.Sleep(1000);
        }
    }

    public void AddData()
    {
        DateTime timeStamp = DateTime.Now;

        foreach (Series ptSeries in chart1.Series)
        {
            AddNewPoint(timeStamp, ptSeries);
        }
    }

    /// The AddNewPoint function is called for each series in the chart when
    /// new points need to be added.  The new point will be placed at specified
    /// X axis (Date/Time) position with a Y value in a range +/- 1 from the previous
    /// data point's Y value, and not smaller than zero.
    public void AddNewPoint(DateTime timeStamp, System.Windows.Forms.DataVisualization.Charting.Series ptSeries)
    {
        double newVal = 0;

        if (ptSeries.Points.Count > 0)
        {
            newVal = ptSeries.Points[ptSeries.Points.Count - 1].YValues[0] + ((rand.NextDouble() * 2) - 1);
        }

        if (newVal < 0)
            newVal = 0;

        // Add new data point to its series.
        chart1.Series.SuspendUpdates();
        ptSeries.Points.AddXY(timeStamp.ToOADate(), rand.Next(10, 20));
        chart1.Series.SuspendUpdates();
        // remove all points from the source series older than 1.5 minutes.
        double removeBefore = timeStamp.AddSeconds((double)(90) * (-1)).ToOADate();
        //remove oldest values to maintain a constant number of data points
        while (ptSeries.Points[0].XValue < removeBefore)
        {
            ptSeries.Points.RemoveAt(0);
        }

        chart1.ChartAreas[0].AxisX.Minimum = ptSeries.Points[0].XValue;
        chart1.ChartAreas[0].AxisX.Maximum = DateTime.FromOADate(ptSeries.Points[0].XValue).AddMinutes(2).ToOADate();


    }

    /// Clean up any resources being used.
    protected override void Dispose(bool disposing)
    {
        if ((addDataRunner.ThreadState & ThreadState.Suspended) == ThreadState.Suspended)
        {
            addDataRunner.Resume();
        }
        addDataRunner.Abort();

        if (disposing)
        {
            if (components != null)
            {
                components.Dispose();
            }
        }
        base.Dispose(disposing);
    }

    private void startTrending_Click_1(object sender, EventArgs e)
    {
        // Disable all controls on the form
        startTrending.Enabled = false;
        // and only Enable the Stop button
        stopTrending.Enabled = true;

        // Predefine the viewing area of the chart
        var minValue = DateTime.Now;
        var maxValue = minValue.AddSeconds(120);

        chart1.ChartAreas[0].AxisX.Minimum = minValue.ToOADate();
        chart1.ChartAreas[0].AxisX.Maximum = maxValue.ToOADate();

        // Reset number of series in the chart.
        chart1.Series.Clear();

        // create a line chart series
        Series newSeries = new Series("Series1");
        newSeries.ChartType = SeriesChartType.Line;
        newSeries.BorderWidth = 2;
        newSeries.Color = Color.OrangeRed;
        newSeries.XValueType = ChartValueType.DateTime;
        chart1.Series.Add(newSeries);

        // start worker threads.
        if (addDataRunner.IsAlive == true)
        {
            addDataRunner.Resume();
        }
        else
        {
            addDataRunner.Start();
        }
    }


    private void stopTrending_Click_1(object sender, EventArgs e)
    {
        if (addDataRunner.IsAlive == true)
        {
            addDataRunner.Suspend();
        }

        // Enable all controls on the form
        startTrending.Enabled = true;
        // and only Disable the Stop button
        stopTrending.Enabled = false;
    }
}
编辑:
我发现只要设置轴的最小值或最大值属性,即使你使用了
chart1.Series.SuspendUpdates();
在调用SuspendUpdates()之后,我不得不删除那些代码行,现在我可以看到图表系列被暂停了。
chart1.ChartAreas[0].AxisX.Minimum = ptSeries.Points[0].XValue;
chart1.ChartAreas[0].AxisX.Maximum = DateTime.FromOADate(ptSeries.Points[0].XValue).AddMinutes(2).ToOADate();
