线性判别分析图表

3
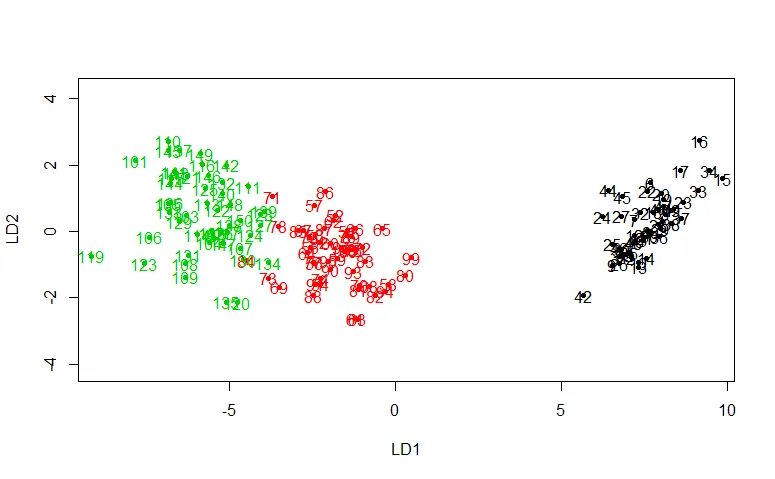
如何将样本ID(行号)添加为LDA图中每个点的标签?
library(MASS)
ldaobject <- lda(Species~., data=iris)
plot(ldaobject, panel = function(x, y, ...) points(x, y, ...),
     col = as.integer(iris$Species), pch = 20)
1个回答

4
您可以在面板函数中使用text:
library(MASS)
ldaobject <- lda(Species~., data=iris)
plot(ldaobject, 
     panel = function(x, y, ...) {
       points(x, y, ...)
       text(x,y,labels=seq_along(x),...) ## You change labels here 
      }
      ,
     col = as.integer(iris$Species), pch = 20)

enter image description here


网页内容由stack overflow 提供, 点击上面的
可以查看英文原文,
原文链接