我喜欢使用Altair来创建区域地图,但是我遇到的最大问题是我无法弄清楚如何改变图例的大小。我已经阅读了文档并尝试了几种方法,但都没有成功。
以下是一个使用Altair文档中的县级失业地图的示例。我添加了一个“config”层,用于同时更改地图和图例标题的字体大小。请注意,“config”中的代码部分包括“.configure_legend()”。
counties = alt.topo_feature(data.us_10m.url, 'counties')
source = data.unemployment.url

foreground = alt.Chart(counties).mark_geoshape(
    ).encode(
    color=alt.Color('rate:Q', sort="descending",  scale=alt.Scale(scheme='plasma'), legend=alt.Legend(title="Unemp Rate", tickCount=6))
).transform_lookup(
    lookup='id',
    from_=alt.LookupData(source, 'id', ['rate'])
).project(
    type='albersUsa'
).properties(
    title="Unemployment Rate by County",
    width=500,
    height=300
)

config = alt.layer(foreground).configure_title(fontSize=20, anchor="middle").configure_legend(titleColor='black', titleFontSize=14)

config
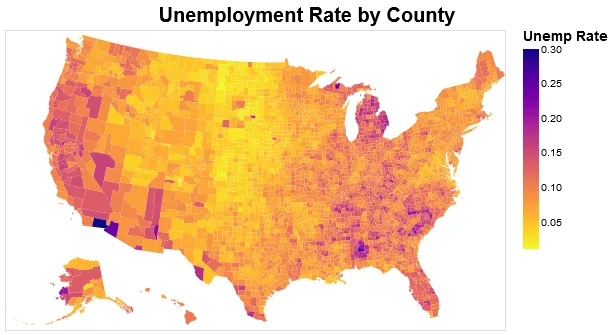
这是图像应该呈现的样子:
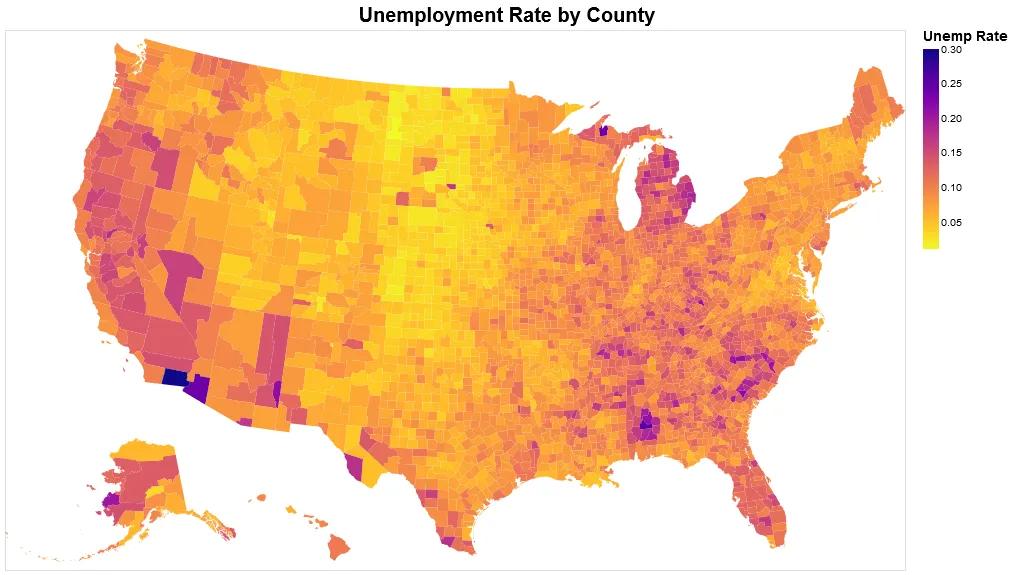
 如果我改变地图的大小,它会变成这样:
counties = alt.topo_feature(data.us_10m.url, 'counties')
source = data.unemployment.url

foreground = alt.Chart(counties).mark_geoshape(
    ).encode(
    color=alt.Color('rate:Q', sort="descending",  scale=alt.Scale(scheme='plasma'), legend=alt.Legend(title="Unemp Rate", tickCount=6))
).transform_lookup(
    lookup='id',
    from_=alt.LookupData(source, 'id', ['rate'])
).project(
    type='albersUsa'
).properties(
    title="Unemployment Rate by County",
    width=900,
    height=540
)

config = alt.layer(foreground).configure_title(fontSize=20, anchor="middle").configure_legend(titleColor='black', titleFontSize=14)

config
图例大小没有改变,因此与地图相比现在看起来非常小:
有人有解决方案吗?