所使用的库是Plotly。
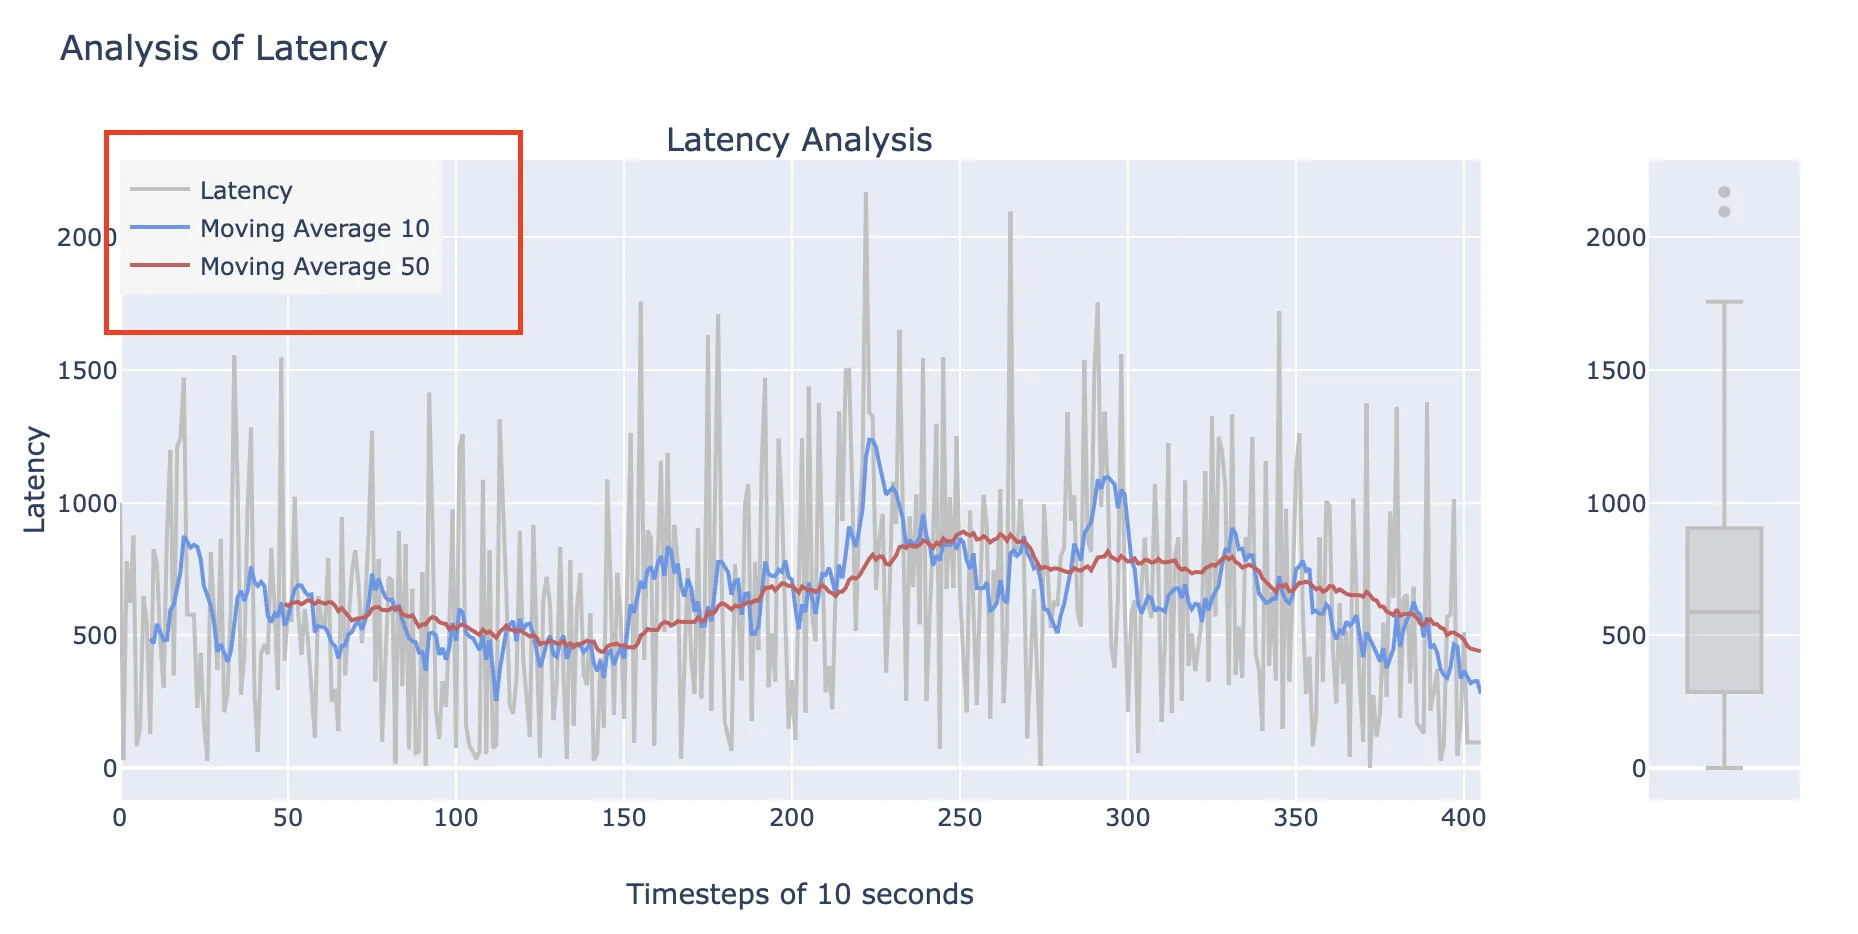
fig.update_layout(showlegend=True, height=500, width=1000, title_text="Analysis of Latency",
                  legend=dict(
                      x=0, y=1,traceorder="normal",font=dict(size=10),bgcolor="WhiteSmoke")
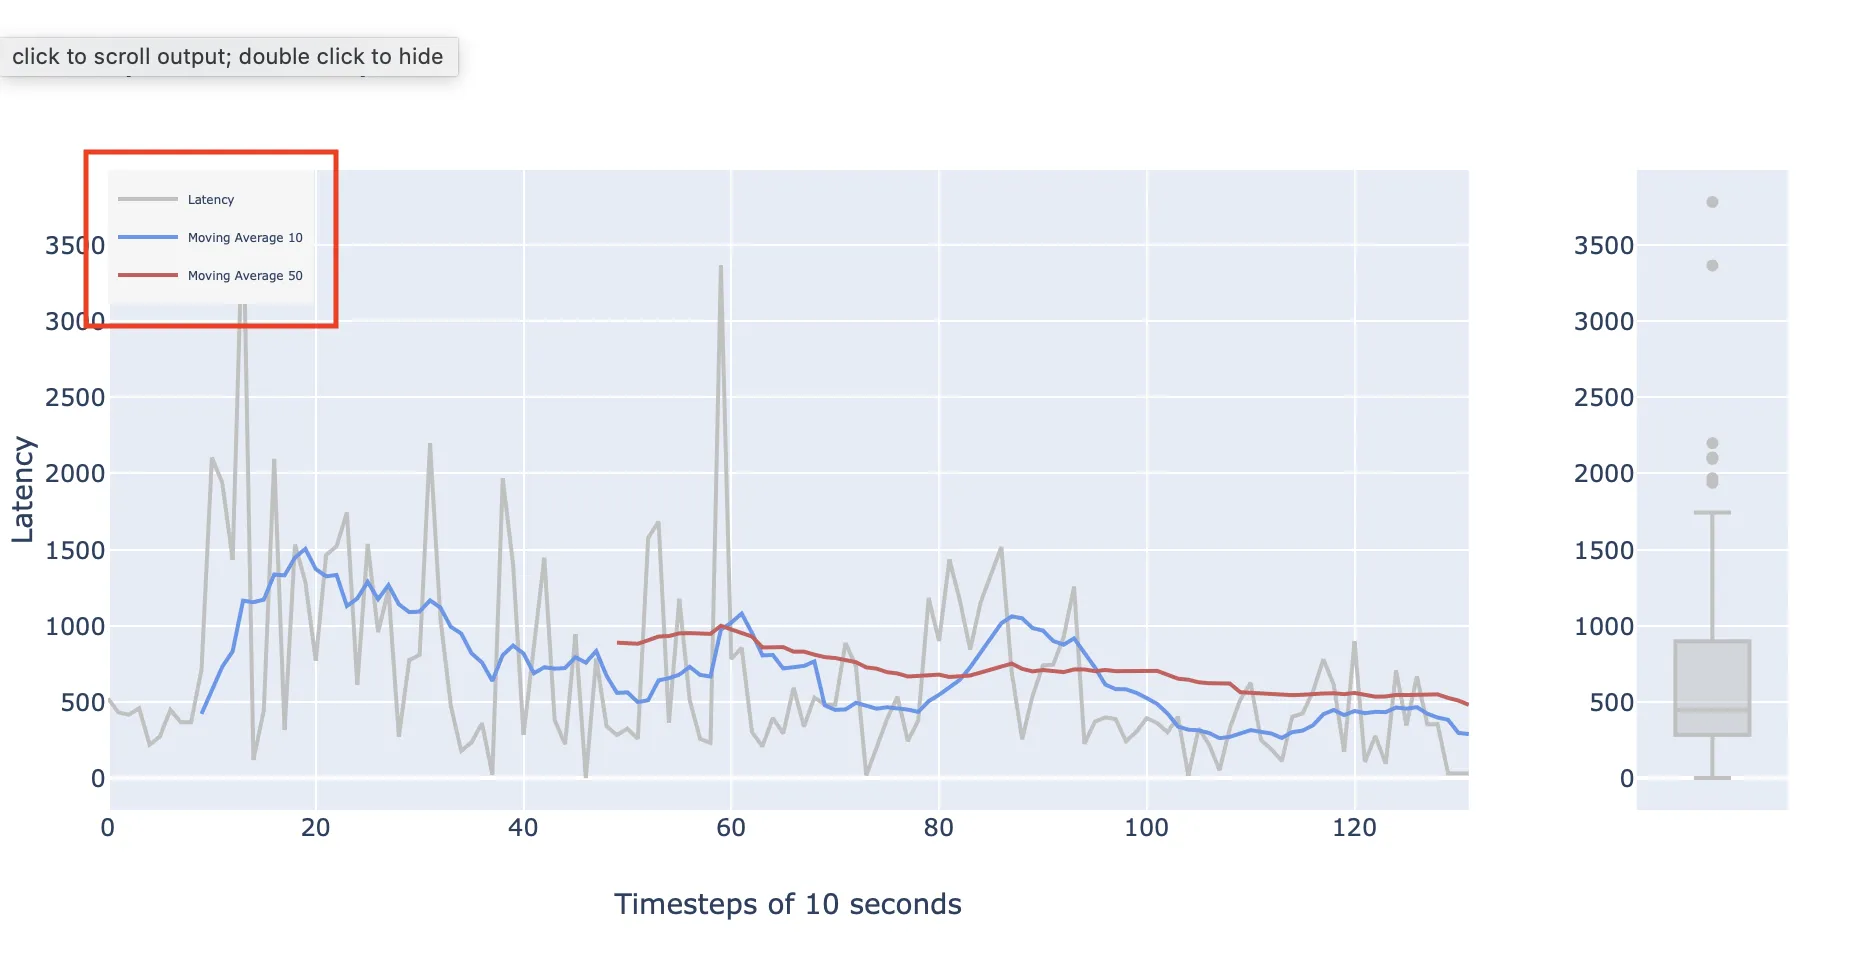
fig.update_layout(showlegend=True, height=500, width=1000, title_text="Analysis of Latency",
legend=dict(
x=0, y=1,traceorder="normal",font=dict(size=10),bgcolor="WhiteSmoke")
在看到一些评论建议这不能完成的各种问题后,似乎有一种相当不错的方法。
legend.sizes = seq(80, 160, 20)
ax = list(zeroline = FALSE, showline = FALSE, showticklabels = FALSE, showgrid = FALSE)
mk = list(sizeref=0.1, sizemode="area")

p.map = plot_geo(DF, locationmode = 'USA-states') %>%
  add_markers(x = ~long, y = ~lat, color = ~Group, size = ~Value, marker = mk) %>%
  layout(geo = list(scope = 'usa'))

p.legend = plot_ly() %>%
  add_markers(x = 1, y = legend.sizes, size = legend.sizes, showlegend = F, marker = mk) %>%
  layout(xaxis = ax, yaxis = list(showgrid = FALSE))

subplot(p.legend, p.map, widths = c(0.1, 0.9))