我正在尝试为一些数组上色,并将其中的一些值转换为np.nan(以便更容易解释),并期望在绘制时出现不同的颜色(白色?),但它导致了绘图和色条的问题。
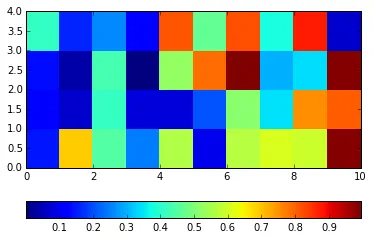
#this is before converted to nan
array = np.random.rand(4,10)
plt.pcolor(array)
plt.colorbar(orientation='horizontal')
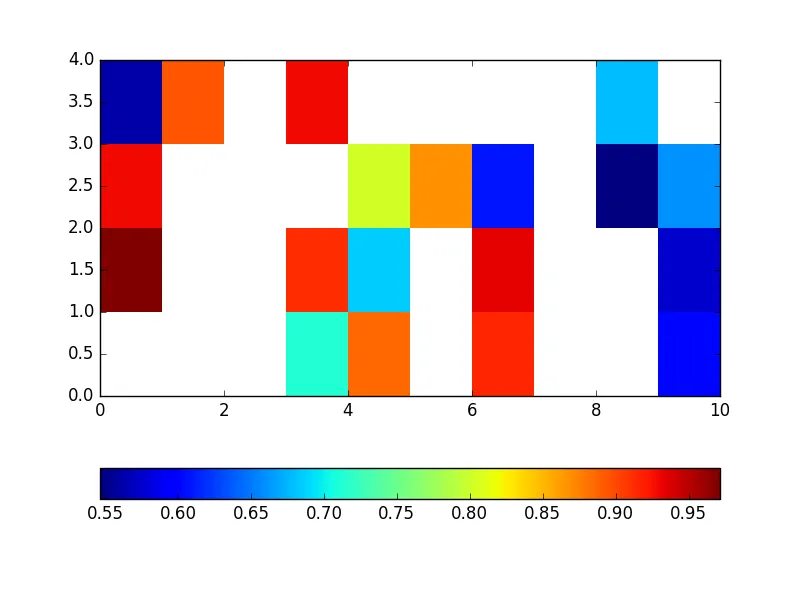
#conditional value converted to nan
array = np.random.rand(4,10)
array[array<0.5]=np.nan
plt.pcolor(array)
plt.colorbar(orientation='horizontal')
有什么建议吗?