在使用
facet_grid 时,ggplot2 会用比通常更宽的白线将组成分面变量的主要类别进行划分。这通常可以满足大多数目的。有时候我想更清楚地显示这些主要分类之间的界限,并希望用另一种颜色对分面进行着色。有没有办法做到这一点?谢谢。虽然有一年的延迟,但我发现这很容易解决:
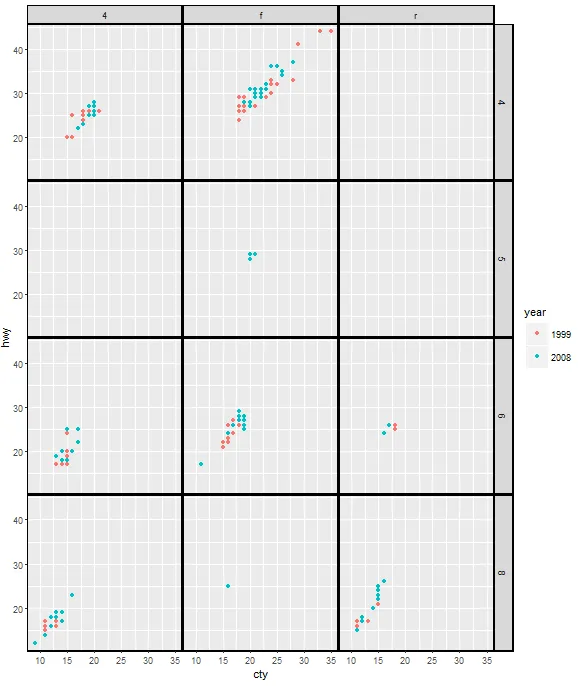
ggplot(mpg, aes(cty, hwy, color = factor(year)))+
  geom_point()+
  facet_grid(cyl ~ drv) +
  theme(panel.margin=unit(.05, "lines"),
        panel.border = element_rect(color = "black", fill = NA, size = 1),
        strip.background = element_rect(color = "black", size = 1))
更新 2021-06-01
从ggplot2 3.3.3开始,属性panel.margin已被弃用,我们应该使用panel.spacing代替。因此,代码应为:
ggplot(mpg, aes(cty, hwy, color = factor(year)))+
  geom_point()+
  facet_grid(cyl ~ drv) +
  theme(panel.spacing = unit(.05, "lines"),
        panel.border = element_rect(color = "black", fill = NA, size = 1),
        strip.background = element_rect(color = "black", size = 1))
ggplot的布局表和gtable函数。library(ggplot2)
library(gtable)
library(grid)
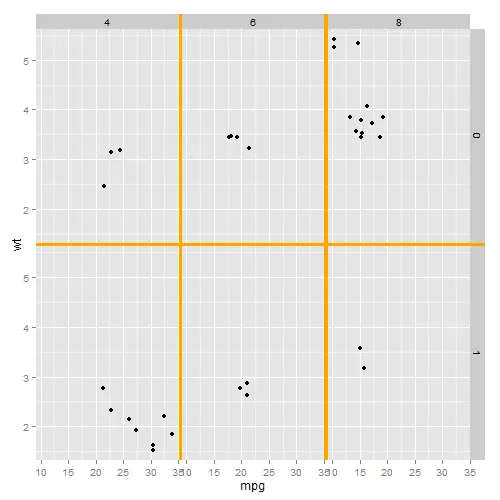
p <- ggplot(mtcars, aes(mpg, wt)) + geom_point() +
facet_grid(am ~ cyl)
## Get the plot grob
gt <- ggplotGrob(p)
## Check the layout
gtable_show_layout(gt) # Vertical gaps are in columns 5 and 7
# and span rows 4 to 9
# Horizontal gap is in row 8
# and spans columns 4 to 9
## To automate the selection of the relevant rows and columns:
## Find the panels in the layout
## (t, l, b, r refer to top, left, bottom, right);
## The gaps' indices are one to the right of the panels' r index (except the right most panel);
## and one below the panels' b index (except the bottom most panel);
## Rmin and Rmax give the span of the horizontal gap;
## Bmin and Bmax give the span of the vertical gap;
## cols and rows are the columns and row indices of the gaps.
panels = subset(gt$layout, grepl("panel", gt$layout$name), t:r)
# The span of the horizontal gap
Rmin = min(panels$r)
Rmax = max(panels$r) + 1
#The span of the vertical gap
Bmin = min(panels$t) - 1
Bmax = max(panels$t)
# The columns and rows of the gaps
cols = unique(panels$r)[-length(unique(panels$r))] + 1
rows = unique(panels$t)[-length(unique(panels$t))] + 1
# The grob - orange rectangle
g = rectGrob(gp = gpar(col = NA, fill = "orange"))
## Add orange rectangles into the vertical and horizontal gaps
gt <- gtable_add_grob(gt,
rep(list(g), length(cols)),
t=Bmin, l=cols, b=Bmax)
gt <- gtable_add_grob(gt,
rep(list(g), length(rows)),
t=rows, l=Rmin, r=Rmax)
## Draw it
grid.newpage()
grid.draw(gt)
gtable允许对初始ggplots进行一些复杂的修改。例如,可以向ggplot布局添加行和列,然后将grobs插入其中。@baptiste在https://github.com/baptiste/gtable/wiki/Description上整理了一些笔记。 - Sandy Musprattggplot对象,而不必直接打印吗? - Frank HarrellcolorFacet的新函数,它将出现在下一个版本的R Hmisc包中,并将您列为作者。 - Frank Harrellggplot或grid的结果,而不必仅仅打印结果对象。一些用户可能希望在最终打印之前更改图形对象或添加图层。 - Frank Harrellstrip.background来控制它,使用element_rect调用进行格式化。qplot(hwy, cty, data = mpg) +
facet_grid(. ~ manufacturer) +
theme(strip.text.x = element_text(size = 8,
colour = "red",
angle = 90),
strip.background = element_rect(fill = "darkblue",
colour = NA)
)
- 更改 panel.border 和 strip.background 的颜色,使用
- 通过增加
为了解决粗线覆盖点的问题,您可以更改绘图的 x 和 y 轴限制。 - yake84element_rect(color = "black"...)panel.margin=unit(.05, "lines")来增加间距