我正在使用 xyplot (lattice) 生成四个图形,并将它们与 grid.arrange (gridExtra) 结合起来。
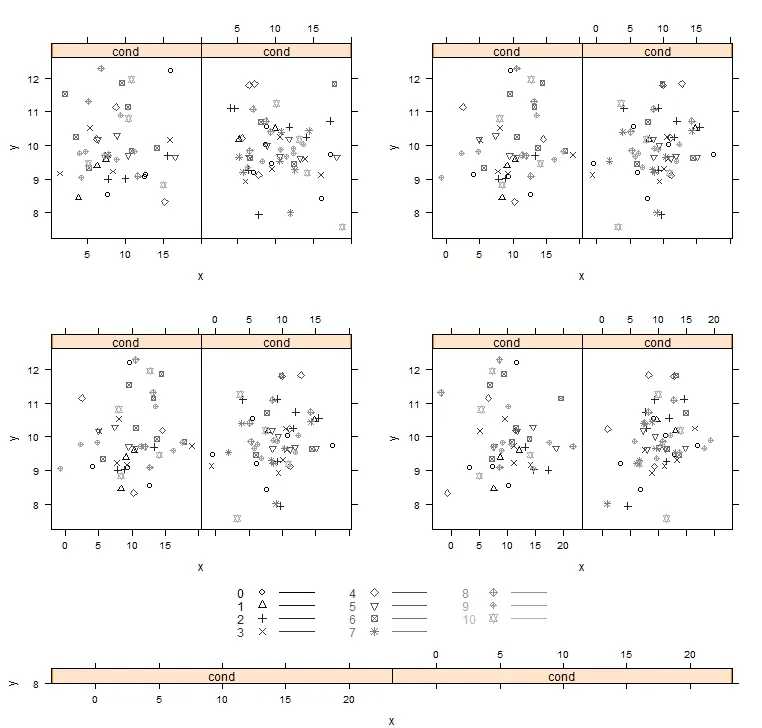
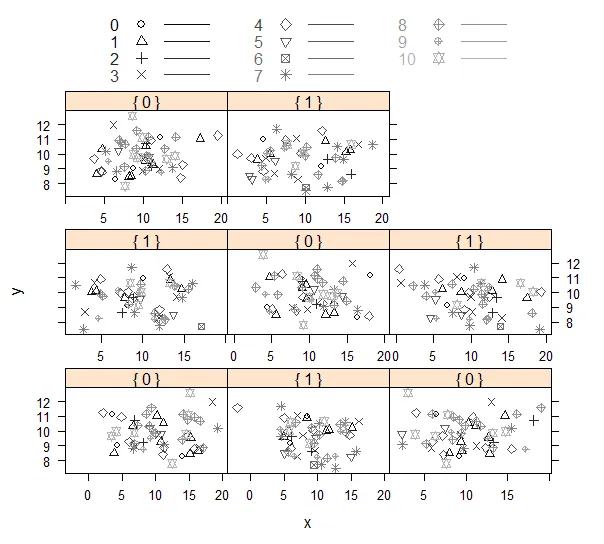
我希望获得一个有公共全局图例的图形。我所达到的最接近的结果如下。它们必须是在矩阵布局中,否则一个选项是将它们放在一列中,并只包括顶部或底部的图例。
# Load packages
require(lattice)
require(gridExtra)

# Generate some values
x1<-rnorm(100,10,4)
x2<-rnorm(100,10,4)
x3<-rnorm(100,10,4)
x4<-rnorm(100,10,4)
y<-rnorm(100,10,1)
cond<-rbinom(100,1,0.5)
groups<-sample(c(0:10),100,replace=TRUE)
dataa<-data.frame(y,x1,x2,x3,x4,cond,groups)

# ploting function
plott<-function(x){
xyplot(y~x|cond,groups=groups,
       col = gray(seq(0.01,0.7,length=length(levels(as.factor(groups))))),
       pch = 1:length(levels(as.factor(groups))),
       key = list(space="top",
                  text = list(as.character(levels(as.factor(groups)))),
                  points = TRUE, lines = TRUE, columns = 3,
                  pch = 1:length(levels(as.factor(groups))),
                  col = gray(seq(0.01,0.7,length=length(levels(as.factor(groups))))),
                  cex=1))
}
plot1<-plott(x=x1)
plot2<-plott(x=x2)
plot3<-plott(x=x3)
plot4<-plott(x=x4)


grid.arrange(plot1,plot2,plot2,plot4,ncol=2)
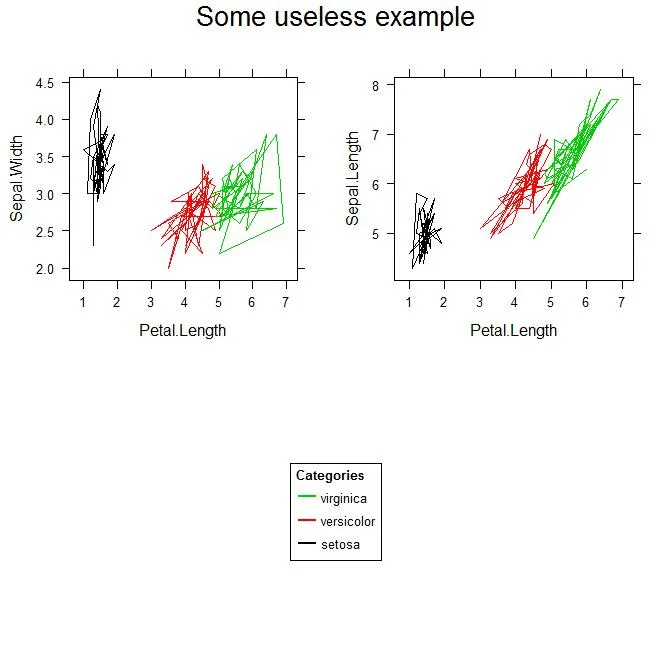
在类似的帖子中,我看到可以使用ggplot2来执行,例如这里和这里,但是是否有一种方法可以使用gridExtra和基于lattice的绘图(例如xyplot)来包含全局公共图例?
谢谢。