我使用gridExtra的grid.arrange创建了一个图表,并尝试在将其保存为.png文件之前为整个图表添加主标题。
使用
我的问题是:如何设置主标题不与顶部边框对齐?一种方法是为整个图表添加总体边距,但我仍然无法弄清楚如何实现。
例如,我修改了SandyMuspratt和Baptiste的代码,从grid arrange to place table and graph on one image开始。
使用
main="TITLE"参数可以工作,但无论我设置图表的高度如何,它都会与顶部边框对齐。我的问题是:如何设置主标题不与顶部边框对齐?一种方法是为整个图表添加总体边距,但我仍然无法弄清楚如何实现。
例如,我修改了SandyMuspratt和Baptiste的代码,从grid arrange to place table and graph on one image开始。
library(ggplot2)
library(gridExtra)
x = read.table(text = "
1/1/2010 10
1/2/2010 20
1/3/2010 15
1/4/2010 56
1/5/2010 46
1/6/2010 15
1/8/2010 15
1/9/2010 15
1/10/2010 20
1/11/2010 15
1/12/2010 15
1/13/2010 40
1/14/2010 15
1/15/2010 15
1/16/2010 70", sep = "", header = FALSE)
p1<-ggplot(x, aes(V2, V1)) + geom_point()
p2<-tableGrob(x)
png( filename = "TEST.png", width = 1700, height = 900, units = "px")
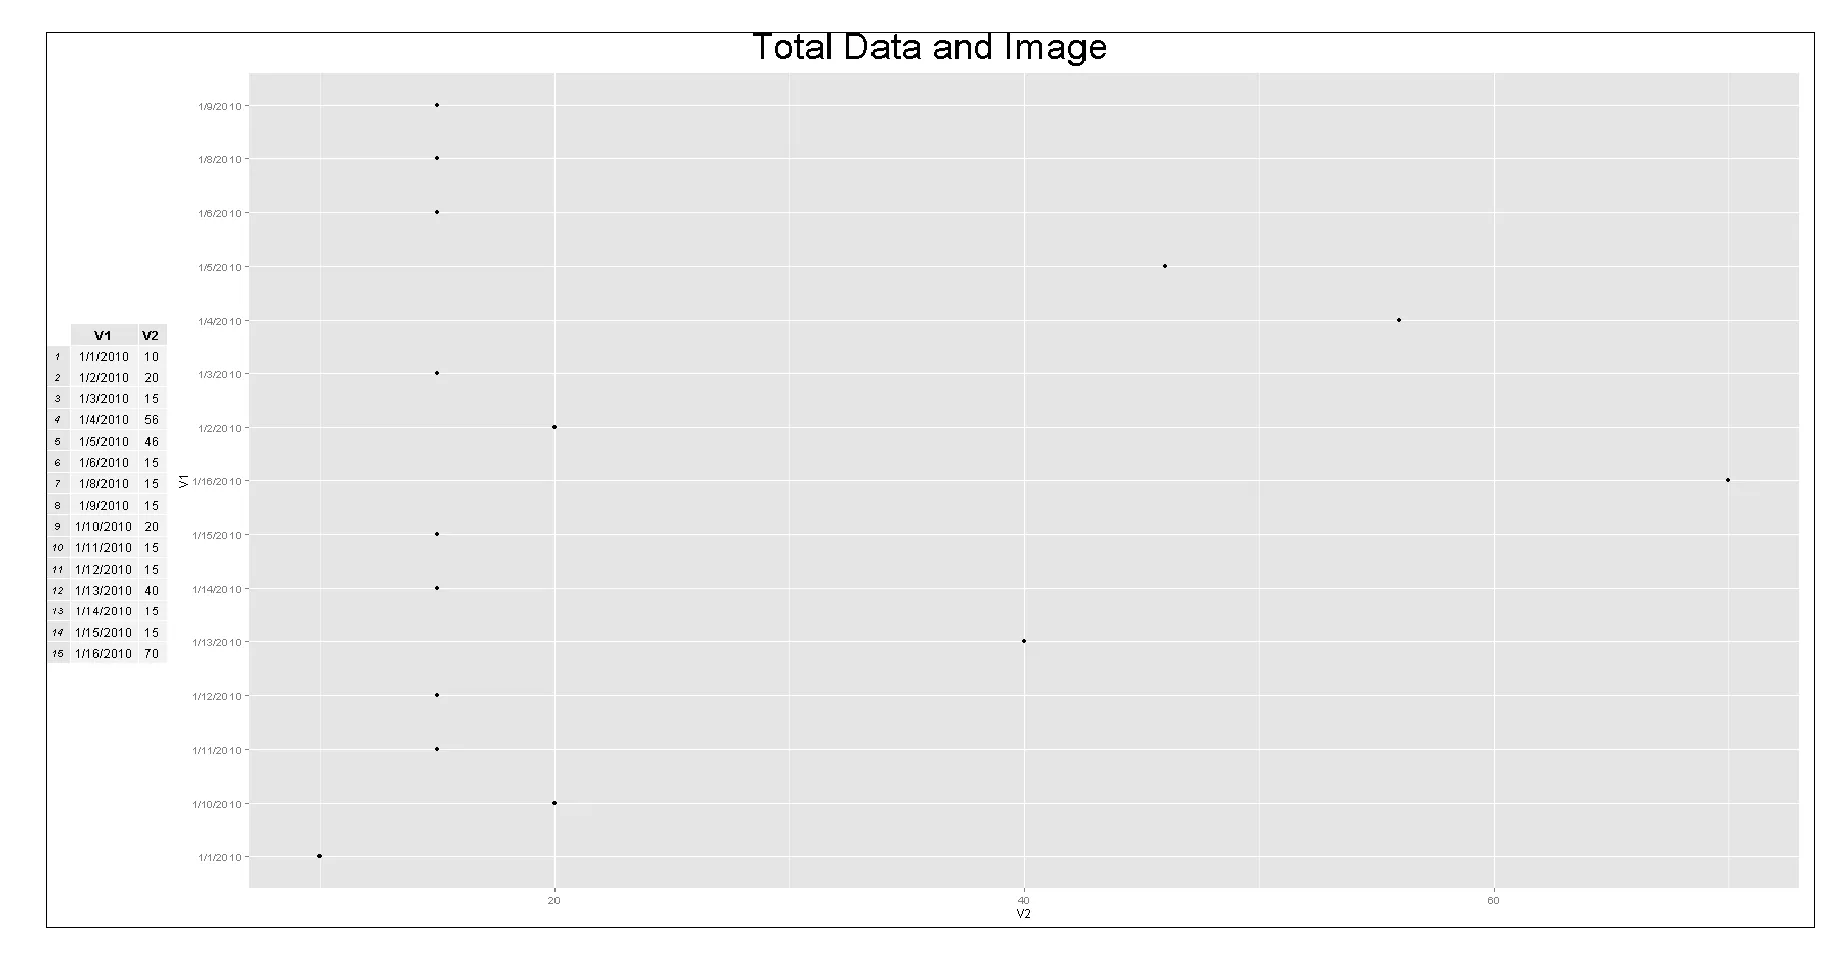
grid.arrange(p2, p1, main=textGrob("Total Data and Image", gp=gpar(cex=3)),
ncol = 2,widths=unit.c(grobWidth(p2), unit(1,"npc") - grobWidth(p2)))
dev.off()
将标题与边框对齐的PNG输出:
我认为解决方案可能相当简单,但我似乎找不到在线解决方案。我已经阅读了?grid.arrange,Adding text to a grid.table plot和其他帖子,但没有提到这一点。
任何帮助将不胜感激,先行致谢!
vjust=0.7而不是just="top"将会把标题放置在垂直空间的正中央。 - NoviceProg