抱歉标题不太好;
我正在尝试重新创建一个matlab图表,但我不太理解他们使用的比例尺。y轴增量如下(从顶部[+ve y]):
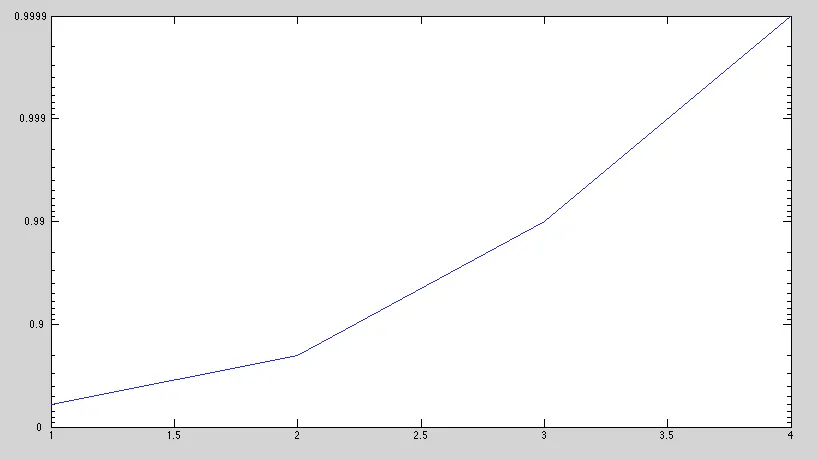
0.9999, 0.999, 0.99, 0.9, 0
我可以使用semilogy绘制对数图,但这有点反过来了;我的增量是
1, 0.1, 0.01, 0.001, 等等
实际上这是1-i,其中i是我真正想要的增量!我并不完全理解如何描述这种类型的图表;有人能帮忙吗?
要按照您想要的方式绘制坐标轴,需要执行三个步骤:(1) 绘制1-y,(2) 反转坐标轴,(3) 重新标注坐标轴。
y = [0.4 0.8 0.99 0.9999];

%# plot 1-y
plot(1-y) %# alternatively use semilog, then you won't have to adjust 'yscale' below

%# reverse y-axis
set(gca,'ydir','reverse','yscale','log')

%# if necessary, set the axis limits here

%# relabel y-axis
set(gca,'yticklabel',num2str(1-10.^str2num(get(gca,'yticklabel'))))
借鉴@Jonas的思路,我将代码重写为新版本的matplotlib。假设y = np.array([0.1, 0.5, 0.9, 0.99, 0.999])
plt.yscale('log')
plt.gca().invert_yaxis()
plt.plot(x, 1-y)
plt.gca().set_yticklabels(1-plt.gca().get_yticks())