如何避免 expand=c(0,0) 裁剪坐标轴刻度标签

5

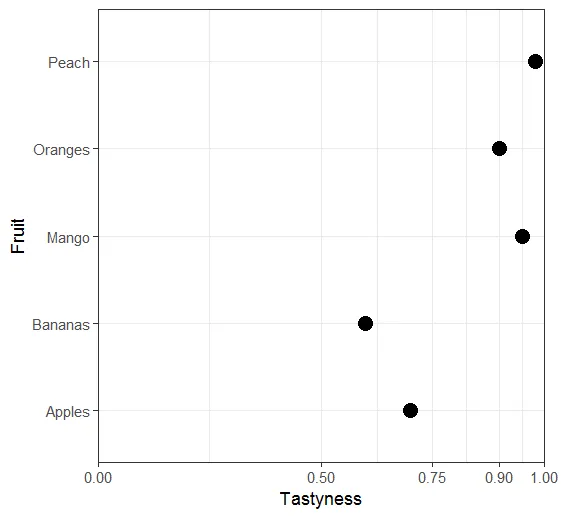
我在制作一个克利夫兰点图,显示0.0和1.0之间的值。

我已经接近我想要的图形,但是有一个小细节让我困扰。因为我使用了expand = c(0,0),所以x轴上1.00中的最后一个0被切断了。

我已经尝试改变各种设置,但是没有成功。

这个问题与这篇文章标题类似,但不幸的是并没有帮助。

您能否帮助我保持图形边界,而不切断x轴上1.00中的最后一个零?

示例:

library(tidyverse)

df <- tibble(
  Tastyness = c(0.6, 0.7, 0.9, 0.95, 0.98),
  Fruit = c("Bananas", "Apples", "Oranges", "Mango", "Peach")
)


ggplot(df, aes(x = Tastyness, y = Fruit)) +
  geom_point(size = 4) +
  theme_bw() +
  scale_x_continuous(
    limits = c(0.0, 1.0),
    expand = c(0, 0),
    breaks = c(0, 0.5, 0.75, 0.9, 1.00)
  )
2个回答

7
一个作用于图表周围边距的解决方案:
ggplot(df, aes(x = Tastyness, y = Fruit)) +
  geom_point(size = 4) +
  theme_bw() +
  scale_x_continuous(
    limits = c(0.0, 1.0),
    expand = c(0, 0),
    breaks = c(0, 0.5, 0.75, 0.9, 1.00)
  ) +
  theme(plot.margin=unit(c(.2,.5,.2,.2),"cm"))

enter image description here


2

或许可以改变标签,使得0和1上没有小数:

ggplot(df, aes(x = Tastyness, y = Fruit)) +
  geom_point(size = 4) +
  theme_bw() +
  scale_x_continuous(
    limits = c(0.0, 1),
    expand = c(0, 0),
    breaks = c(0, 0.5, 0.75, 0.9, 1.00),
    labels = c(0, 0.5, 0.75, 0.9, 1))

这里输入图片描述

或者水平移动标签:

ggplot(df, aes(x = Tastyness, y = Fruit)) +
  geom_point(size = 4) +
  theme_bw() +
  scale_x_continuous(
    limits = c(0.0, 1),
    expand = c(0, 0),
    breaks = c(0, 0.5, 0.75, 0.9, 1.00)) +
  theme(axis.text.x = element_text(hjust = 1))

enter image description here


网页内容由stack overflow 提供, 点击上面的
可以查看英文原文,
原文链接