如何使用ggplot2在多个PDF页面中生成图表

7
我需要帮助将图形处理成多个pdf页面。这是我的当前代码:
file <- read.csv(file="file.csv") 
library(ggplot2)
library(gridExtra)
library(plyr)

gg1 <- ggplot() +
  geom_line(aes(x=TIME, y=var1, colour = "z1"), file) +
  geom_line(aes(x=TIME, y=var2, colour = "z2"), file) + 
  geom_point(aes(x=TIME, y=var3), file) + facet_wrap( ~ ID, ncol=5)+ 
  xlab("x") +
  ylab("Y") +
  ggtitle(" x ") + scale_colour_manual(name="Legend",
    values=c(z1="red", z2 ="blue")) + theme(legend.position="bottom")   
gg10 = do.call(marrangeGrob, c(gg1, list(nrow=4, ncol=4)))
ggsave("need10.pdf", gg10)
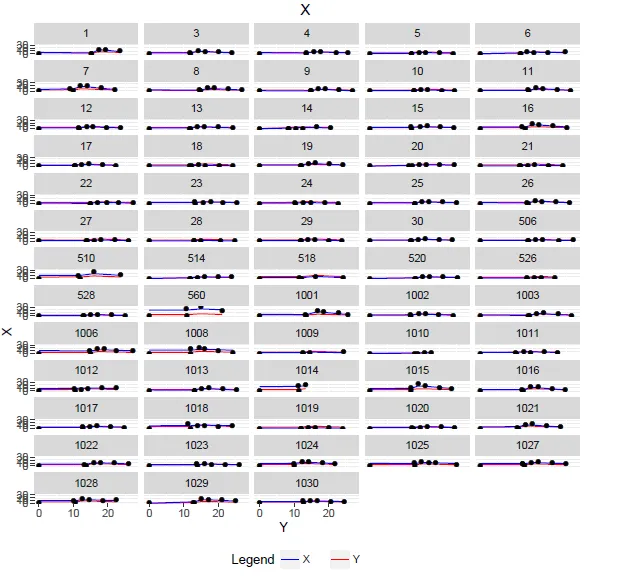
以下是未分割图像创建的图像

在此输入图片描述

我希望有一段代码,能将我的图表以4x4的布局显示在多个页面上。我的代码最后两行需要调整,但我不知道如何自己解决。


1
这似乎很有用:ggplot2的一组附加函数。我谷歌搜索了“facet_wrap多页”。 - Weihuang Wong
我替换了 
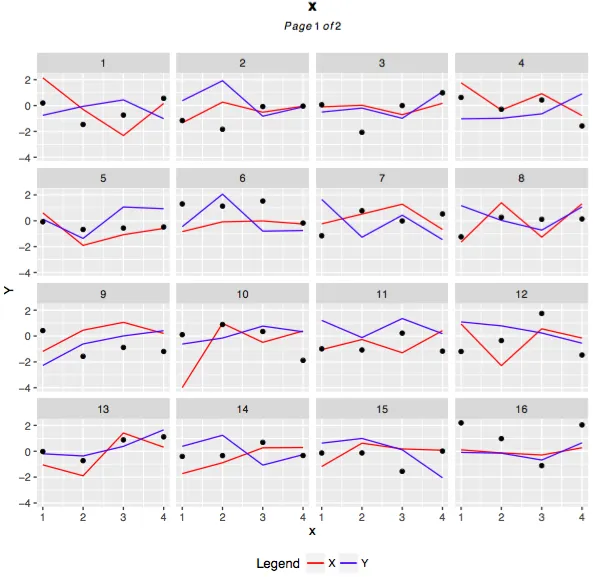
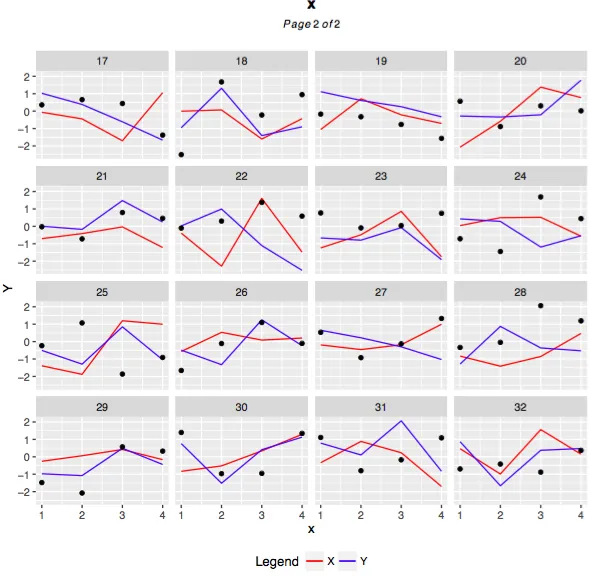
multi.plot <- marrangeGrob(grobs = gg1, nrow = 2, ncol = 2, top = quote(paste(gg1$labels$title,'\nPage', g, 'of', pages))) pdf('Example_marrangeGrob.pdf', w = 12, h = 8) print(multi.plot) dev.off() ,但是收到了错误信息“Error in gList(data = list(wrapvp = list(x = 0.5, y = 0.5, width = 1, : only 'grobs' allowed in "gList"”。有没有办法解决这个问题? - Monklife
2个回答

14

看起来ggplus包可以实现你想要的功能。我在下方的代码块中对原始代码进行了一些更改:facet_wrap被注释掉了,并且file已经移动到ggplot中,这样它就不必在每个geom_*中重新指定:

gg1 <- ggplot(file) +
  geom_line(aes(x=TIME, y=var1, colour = "z1")) +
  geom_line(aes(x=TIME, y=var2, colour = "z2")) + 
  geom_point(aes(x=TIME, y=var3)) +
  # facet_wrap( ~ ID, ncol=5) +
  xlab("x") +
  ylab("Y") +
  ggtitle(" x ") + 
  scale_colour_manual(name="Legend",
    values=c(z1="red", z2 ="blue"),
    labels=c("X","Y")) +
  theme(legend.position="bottom")   

devtools::install_github("guiastrennec/ggplus")
library(ggplus)
pdf("need10.pdf")
gg10 <- facet_multiple(plot=gg1, facets="ID", ncol = 4, nrow = 4)
dev.off()

在此输入图片描述 在此输入图片描述


非常非常感谢!!!这太棒了!它让我节省了大约4个小时的查找时间。 - Monklife
最后一页不会打印图表。 - Hardik Gupta
我非常感谢您能帮忙解答这个问题。 https://stackoverflow.com/questions/45475249/ggplusplots-on-multiple-pages - shiny

1

四年后...

由于 ggplus 已经过时,您可以考虑使用 ggforce。您可以使用文档中描述的任何相关 facet_* 选项。例如,facet_matrix:

# Standard use:
ggplot(mpg) +
  geom_point(aes(x = .panel_x, y = .panel_y)) +
  facet_matrix(vars(displ, cty, hwy))

enter image description here


网页内容由stack overflow 提供, 点击上面的
可以查看英文原文,
原文链接