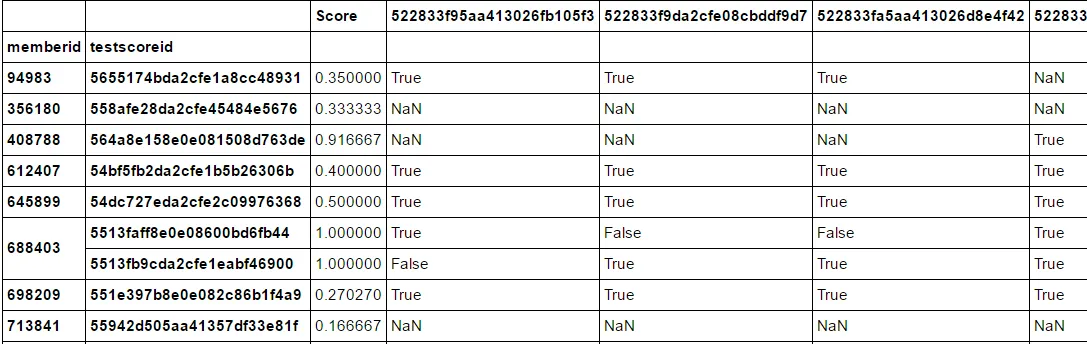
我有下面这个用
pivot_table生成的数据框:
我正在使用以下代码对多列进行boxplot绘制:
    fig = plt.figure()
for i in range(0,25):
    ax = plt.subplot(1,2,i+1)
    toPlot1.boxplot(column='Score',by=toPlot1.columns[i+1],ax=ax)
fig.suptitle('test title', fontsize=20)
plt.show()
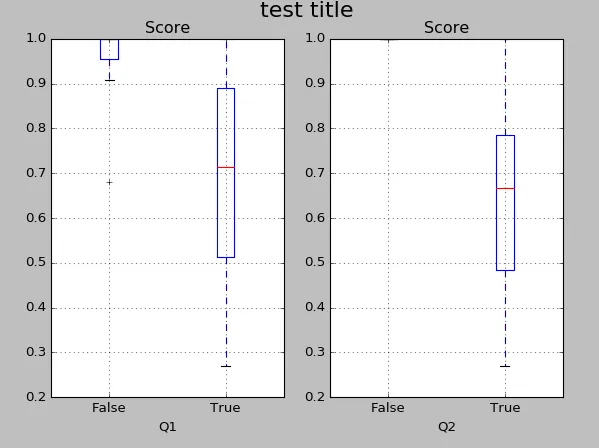
我原本期望的输出应该是下面这样的:
但是这段代码却给了我以下错误:
---------------------------------------------------------------------------
ValueError                                Traceback (most recent call last)
<ipython-input-275-9c68ce91596f> in <module>()
      1 fig = plt.figure()
      2 for i in range(0,25):
----> 3     ax = plt.subplot(1,2,i+1)
      4     toPlot1.boxplot(column='Score',by=toPlot1.columns[i+1],ax=ax)
      5 fig.suptitle('test title', fontsize=20)

E:\Anaconda2\lib\site-packages\matplotlib\pyplot.pyc in subplot(*args, **kwargs)
   1020
   1021     fig = gcf()
-> 1022     a = fig.add_subplot(*args, **kwargs)
   1023     bbox = a.bbox
   1024     byebye = []

E:\Anaconda2\lib\site-packages\matplotlib\figure.pyc in add_subplot(self, *args, **kwargs)
   1003                     self._axstack.remove(ax)
   1004
-> 1005             a = subplot_class_factory(projection_class)(self, *args, **kwargs)
   1006
   1007         self._axstack.add(key, a)

E:\Anaconda2\lib\site-packages\matplotlib\axes\_subplots.pyc in __init__(self, fig, *args, **kwargs)
     62                     raise ValueError(
     63                         "num must be 1 <= num <= {maxn}, not {num}".format(
---> 64                             maxn=rows*cols, num=num))
     65                 self._subplotspec = GridSpec(rows, cols)[int(num) - 1]
     66                 # num - 1 for converting from MATLAB to python indexing

ValueError: num must be 1 <= num <= 2, not 3
我认为这是因为一个图表上只能显示两个箱线图?
有任何解决办法吗?非常感谢您的指点。
先行致谢。