我正在开发一款Android应用程序。在我的应用中,我需要显示一个带有多种颜色的条形图,因此我使用了charts4j库。我使用了以下链接中的代码 charts4j示例。
现在的问题是,如果条形数量超过屏幕范围,我只能显示固定数量的条形,无法滚动查看其余的条形。以下是我的截图。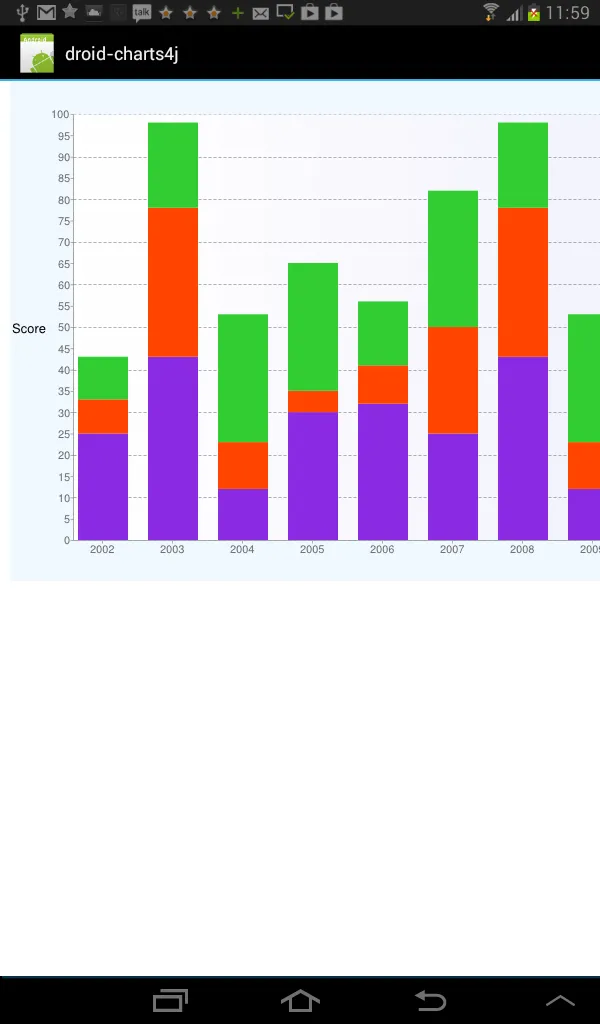 2
以下是我用来生成条形图的代码。
2
以下是我用来生成条形图的代码。
现在的问题是,如果条形数量超过屏幕范围,我只能显示固定数量的条形,无法滚动查看其余的条形。以下是我的截图。
2
以下是我用来生成条形图的代码。 public static String getBarChartUrl()
{
BarChartPlot team1 = Plots.newBarChartPlot( Data.newData( 25, 43, 12, 30,32,25, 43, 12, 30,32,25,25, 43, 12, 30,32,25 ), BLUEVIOLET, "Team A" );
BarChartPlot team2 = Plots.newBarChartPlot( Data.newData( 8, 35, 11, 5,9,25, 35, 11, 5,9,25,25, 43, 12, 30,32,25 ), ORANGERED, "Team B" );
BarChartPlot team3 = Plots.newBarChartPlot( Data.newData( 10, 20, 30, 30 ,15,32, 20, 30, 30 ,15,32,25, 43, 12, 30,32,25), LIMEGREEN, "Team C" );
// Instantiating chart.
BarChart chart = GCharts.newBarChart( team1, team2, team3 );
// Defining axis info and styles
AxisStyle axisStyle = AxisStyle.newAxisStyle( BLACK, 13, AxisTextAlignment.CENTER );
AxisLabels score = AxisLabelsFactory.newAxisLabels( "Score", 50.0 );
score.setAxisStyle( axisStyle );
AxisLabels year = AxisLabelsFactory.newAxisLabels( "Year", 50.0 );
year.setAxisStyle( axisStyle );
// Adding axis info to chart.
chart.addXAxisLabels( AxisLabelsFactory.newAxisLabels( "2002", "2003", "2004", "2005","2006","2007","2008","2009","2010","2011","2012","2013","2014","2015","2016","2017","2018" ) );
chart.addYAxisLabels( AxisLabelsFactory.newNumericRangeAxisLabels( 0, 100 ) );
chart.addYAxisLabels( score );
chart.addXAxisLabels( year );
chart.setSize( 600, 450 );
chart.setBarWidth( 50 );
chart.setSpaceWithinGroupsOfBars( 20 );
chart.setDataStacked( true );
chart.setTitle( "Team Scores", BLACK, 16 );
chart.setGrid( 100, 10, 3, 2 );
chart.setBackgroundFill( Fills.newSolidFill( ALICEBLUE ) );
LinearGradientFill fill = Fills.newLinearGradientFill( 0, LAVENDER, 100 );
fill.addColorAndOffset( WHITE, 0 );
chart.setAreaFill( fill );
String url = chart.toURLString();
return normalize( url );
}
我的问题是
1)根据数据应该显示17个柱形图,但只显示了8个[从2002年到2018年,现在只显示到2009年]。如何通过横向滚动查看其余的柱形图。
2)如果柱形图数量少,我可以查看标签[代表每种数据的颜色]。请查看以下图片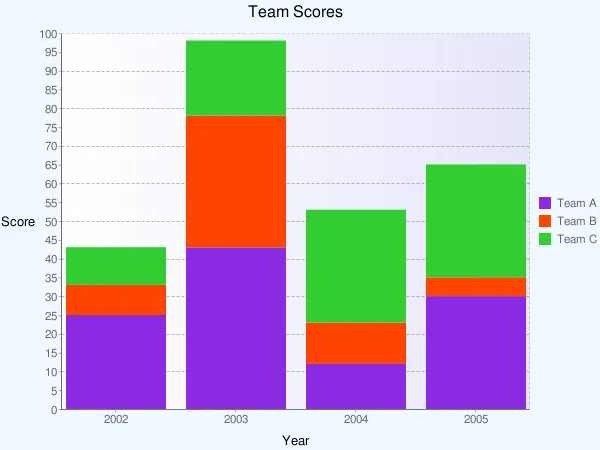
如果数量较多,则无法查看标签。请参见第一张图片。
3) 我想知道是否有办法为边框单独设置背景颜色。 我的意思是分别为成绩和年份设置。
请帮我找到解决方案。