将NumPy 2D数组中的所有2D点连接成三角形网格

3

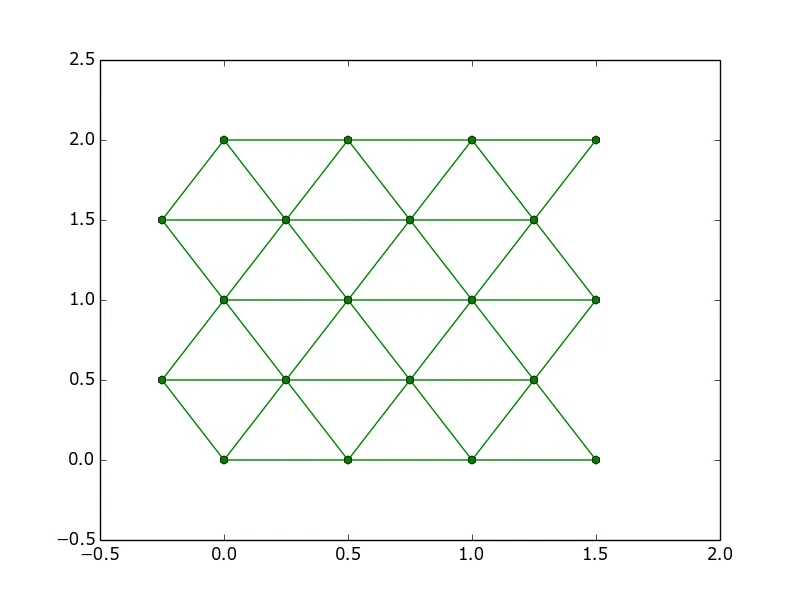
我是Python的新手,我想绘制一个类似于这样的三角形网格:

import matplotlib.pyplot as plt
import numpy as np

r   = 0.25
d   = 2*r
s   = 0

l1 = np.array([[s,0], [s+d,0], [s+2*d,0], [s+3*d,0]]) 
l2 = np.array([[s-r,d], [s+r,d], [s+r+d,d], [s+r+2*d,d]])
l3 = np.array([[s,2*d], [s+d,2*d], [s+2*d,2*d], [s+3*d,2*d]])
l4 = np.array([[s-r,3*d], [s+r,3*d], [s+r+d,3*d], [s+r+2*d,3*d]])
l5 = np.array([[s,4*d], [s+d,4*d], [s+2*d,4*d], [s+3*d,4*d]])

plt.scatter(*zip(*l1))
plt.scatter(*zip(*l2))
plt.scatter(*zip(*l3))
plt.scatter(*zip(*l4))
plt.scatter(*zip(*l5))

plt.show

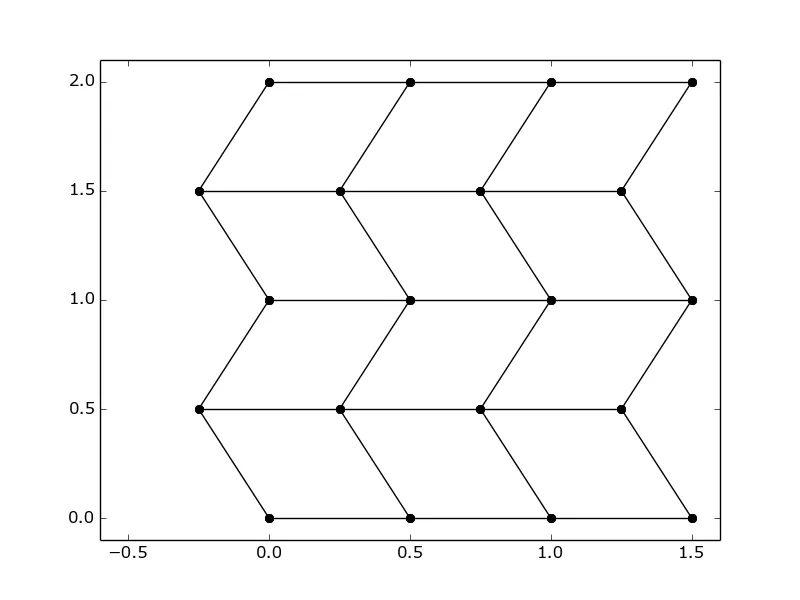
我的问题是,我不知道如何连接所有的点。我已经使用plt.plot(*zip(*l1))为所有的l添加了水平线,但是我不知道如何画出“垂直”的之字形线条...有没有人有一个“简单”的解决方案?

非常感谢您提前的帮助!


请访问 http://matplotlib.org/examples/pylab_examples/triplot_demo.html。 - GBy
2个回答

2

triplot 用于绘制三角形。你可以只传递 xy 坐标(此时程序会计算 Delaunay 三角剖分),或者传递一个完整的 Triangulation 对象,以指定自己的三角形。

import matplotlib.pyplot as plt
import numpy as np
import matplotlib.tri as mtri

r = 0.25
d = 2*r
s = 0

def meshgrid_triangles(n, m):
    """ Returns triangles to mesh a np.meshgrid of n x m points """
    tri = []
    for i in range(n-1):
        for j in range(m-1):
            a = i + j*(n)
            b = (i+1) + j*n
            d = i + (j+1)*n
            c = (i+1) + (j+1)*n
            if j%2 == 1:
                tri += [[a, b, d], [b, c, d]]
            else:
                tri += [[a, b, c], [a, c, d]]
    return np.array(tri, dtype=np.int32)


x0 = np.arange(4) * d
y0 = np.arange(5) * d
x, y = np.meshgrid(x0, y0)
x[1::2] -= r
triangles = meshgrid_triangles(4, 5)
triangulation = mtri.Triangulation(x.ravel(), y.ravel(), triangles)
plt.scatter(x, y, color='red')
plt.triplot(triangulation, 'g-h')

plt.show()

enter image description here


谢谢@GBy,我接受了你的帖子作为答案,因为这个三维图很容易理解。所以感谢你的代码和帮助! :) - SherabWangchuk

1
使用您现有的代码(否则根据@GBy的建议查看triplot_demo,具体取决于您想要的内容),您可以提取或旋转每个数组,使得只需绘制向下的线条。
import matplotlib.pyplot as plt
import numpy as np

r   = 0.25
d   = 2*r
s   = 0

l1 = np.array([[s,0], [s+d,0], [s+2*d,0], [s+3*d,0]])
l2 = np.array([[s-r,d], [s+r,d], [s+r+d,d], [s+r+2*d,d]])
l3 = np.array([[s,2*d], [s+d,2*d], [s+2*d,2*d], [s+3*d,2*d]])
l4 = np.array([[s-r,3*d], [s+r,3*d], [s+r+d,3*d], [s+r+2*d,3*d]])
l5 = np.array([[s,4*d], [s+d,4*d], [s+2*d,4*d], [s+3*d,4*d]])

fig = plt.figure(0)
ax = fig.add_subplot(111)

larr = [l1,l2,l3,l4,l5]

# Plot horizontally
for l in larr:

  # same as your *zip(*l1), but you can select on a column-wise basis
  ax.errorbar(l[:,0], l[:,1], fmt="o", ls="-", color="black")

# Plot zig-zag-horizontally
for i in range(len(larr[0])):

  lxtmp = np.array([x[:,0][i] for x in larr])
  lytmp = np.array([x[:,1][i] for x in larr])

  ax.errorbar(lxtmp, lytmp, fmt="o", ls="-", color="black")

ax.set_ylim([-0.1,2.1])
ax.set_xlim([-0.6,1.6])

plt.show()

plot image

编辑:

lxtmp = np.array([x[:,0][i] for x in larr])

所以,x[:,0] 表示取所有的行 ":" 但只取第一列 "0"。对于 l1,它将返回:
l1[:,0]
array([ 0. ,  0.5,  1. ,  1.5])

这是关于编程的内容,涉及到l1的x值。使用l1[:,1]将返回所有行的第一列,即y值。为了绘制垂直线条,您需要从每个i-th数组中获取所有x和y值,因此需要循环遍历所有数组,取出第i个元素。例如,第三个垂直的锯齿线将是:

lxtmp = [l1[:,0][2], l2[:,0][2], l3[:,0][2], l4[:,0][2], l5[:,0][2]]
lytmp = [l1[:,1][2], l2[:,1][2], l3[:,1][2], l4[:,1][2], l5[:,1][2]]

为了简化并遍历每个元素,我创建了“larr”来循环并以正常的Python方式构建它们,例如:
[i for i in range(1,10)]
[1, 2, 3, 4, 5, 6, 7, 8, 9]

非常感谢您的回答!您能解释一下lxtmplytmp是如何构建的吗?不幸的是,我不习惯这种...数组构建 :) 另外,我无法构建一个for循环来绘制“其他”之字形线条,例如从(0,0)到(0.25,0.5)等。 - SherabWangchuk
我更新了你第一个问题的答案。关于第二个问题,最好使用 @GBy 的建议。我会尽快调查这个问题。 - jonnybazookatone
非常感谢@jonnybazookatone!那确实帮了很多忙! :) - SherabWangchuk

网页内容由stack overflow 提供, 点击上面的
可以查看英文原文,
原文链接