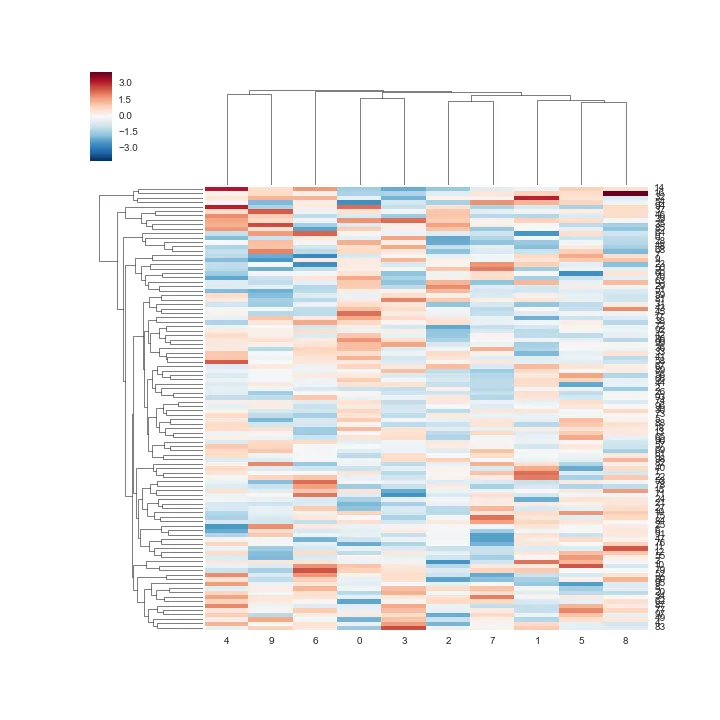
我正在使用Seaborn制作一个聚类热图,如下所示。
import numpy as np
import seaborn as sns
np.random.seed(2)
data = np.random.randn(100, 10)
sns.clustermap(data)
但行之间被压缩了:
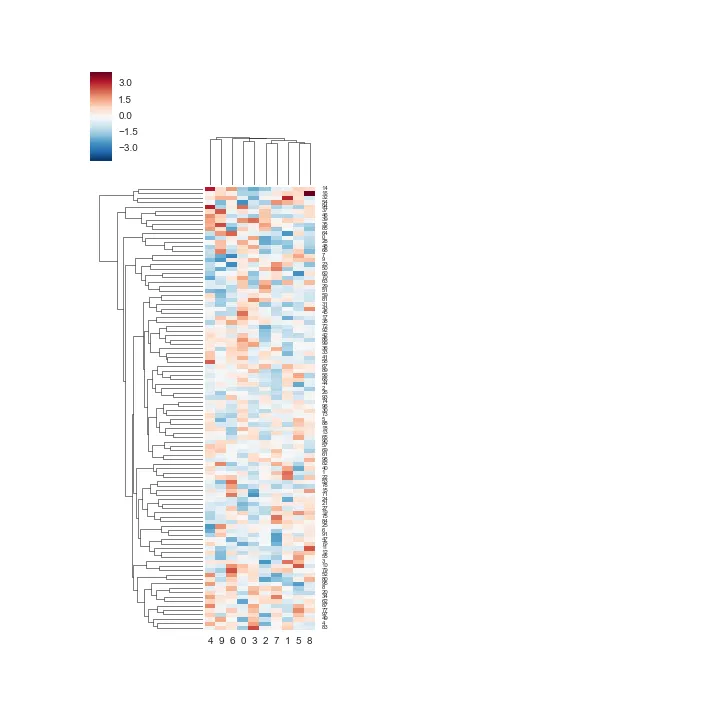
但是如果我向clustermap函数传递一个大小,那么它看起来很糟糕。

是否有一种方法只增加热图部分的大小?这样可以读取行名称,但不会拉伸聚类部分。
ax_heatmap.set_position方法。当然,你还需要改变树状图轴。 - mwaskom