如何在添加另一个y轴的同时旋转x轴标签?

4

由于某种原因,在我添加第二个y轴到我的图表之后

fig.plt.figure()
ax = plt.Axes(fig)
fig.add_axes(ax)
ax2 = ax.twinx()
fig.add_axes(ax2)
<结果> xticklabels不再旋转!?
fig.autofmt_xdate(rotation = num)

有人知道为什么会发生这种情况吗?

我可以将最后两行注释掉:

#ax2 = ax.twinx()
#fig.add_axes(ax2)

它将旋转xticklabels。
1个回答

7
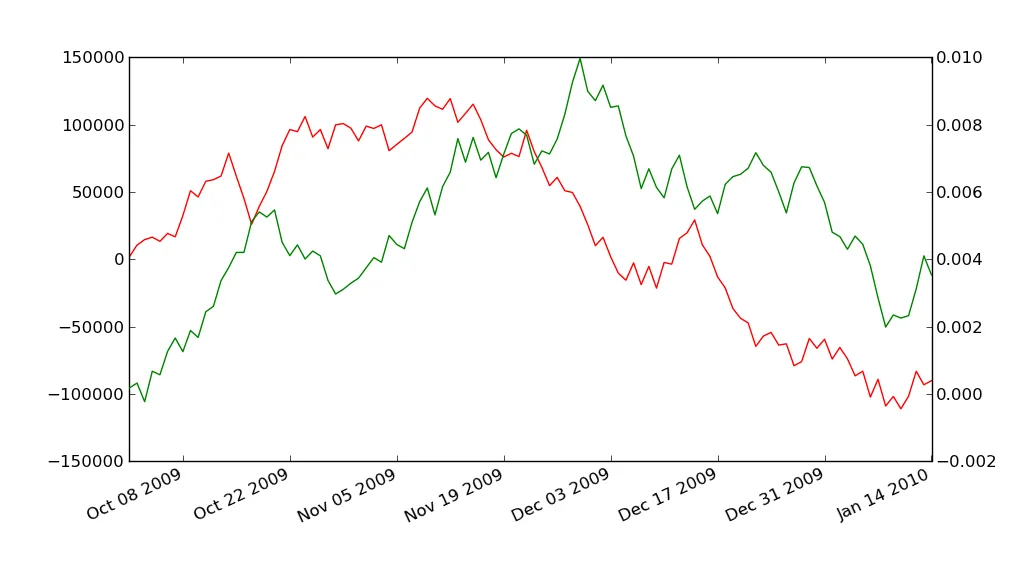
在定义ax语句之后但在调用ax.twinx()之前,使用fig.autofmt_xdate(rotation = num)来进行设置。
import matplotlib.pyplot as plt
import matplotlib.dates as md
import datetime as dt
import numpy as np

np.random.seed(0)
t=md.drange(dt.datetime(2009,10,1),
            dt.datetime(2010,1,15),
            dt.timedelta(days=1))
n=len(t)
x1 = np.cumsum(np.random.random(n) - 0.5) * 40000
x2 = np.cumsum(np.random.random(n) - 0.5) * 0.002

fig = plt.figure()
# fig.autofmt_xdate(rotation=25) # does not work
ax1 = fig.add_subplot(1,1,1)
fig.autofmt_xdate(rotation=25) # works
ax2 = ax1.twinx()
# fig.autofmt_xdate(rotation=25) # does not work
ax1.plot_date(t, x1, 'r-')
ax2.plot_date(t, x2, 'g-')
plt.show()

收益率 enter image description here

就是这样!我很感激帮助。 - Casa

网页内容由stack overflow 提供, 点击上面的
可以查看英文原文,
原文链接