设置
始终提供可重现问题的示例数据。
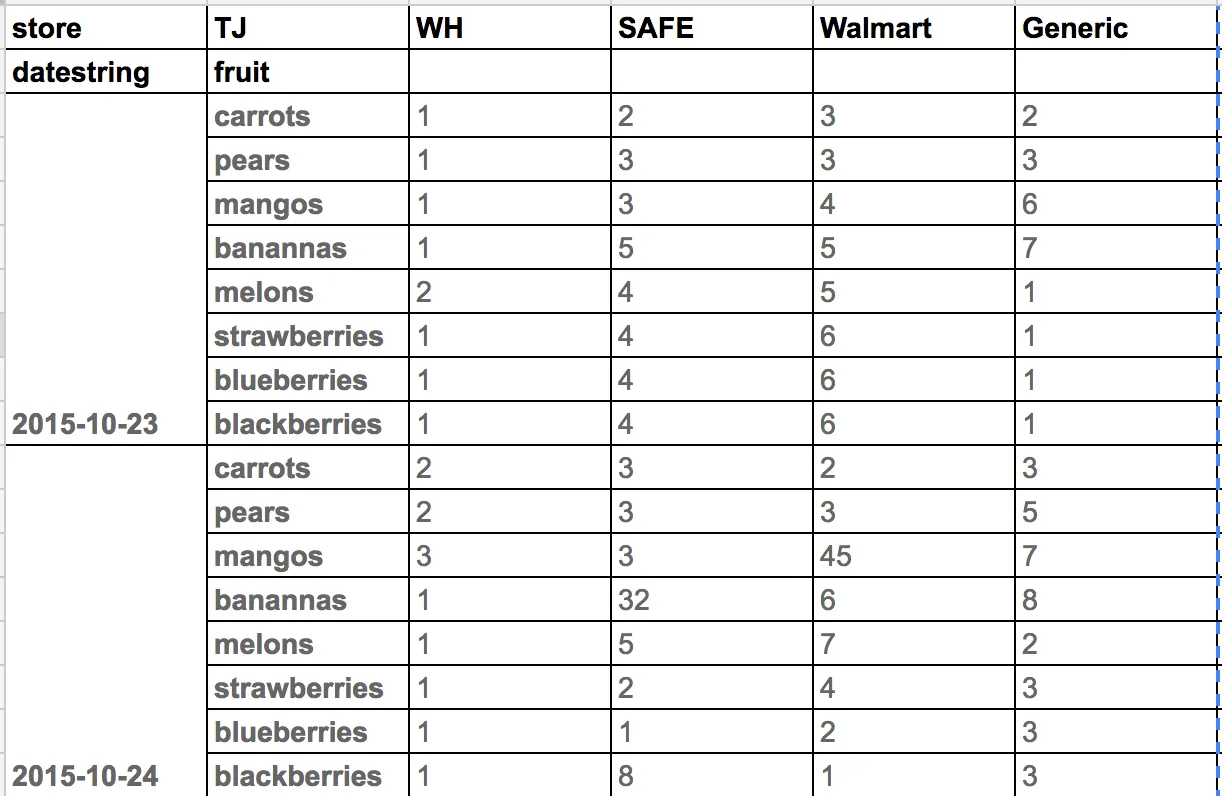
我在此提供了一些示例数据。
cols = pd.Index(['TJ', 'WH', 'SAFE', 'Walmart', 'Generic'], name='Store')
dates = ['2015-10-23', '2015-10-24']
fruit = ['carrots', 'pears', 'mangos', 'banannas',
         'melons', 'strawberries', 'blueberries', 'blackberries']
rows = pd.MultiIndex.from_product([dates, fruit], names=['datestring', 'fruit'])
df = pd.DataFrame(np.random.randint(50, size=(16, 5)), rows, cols)
df
首先,您需要使用pd.to_datetime将行索引的第一层转换为日期格式。
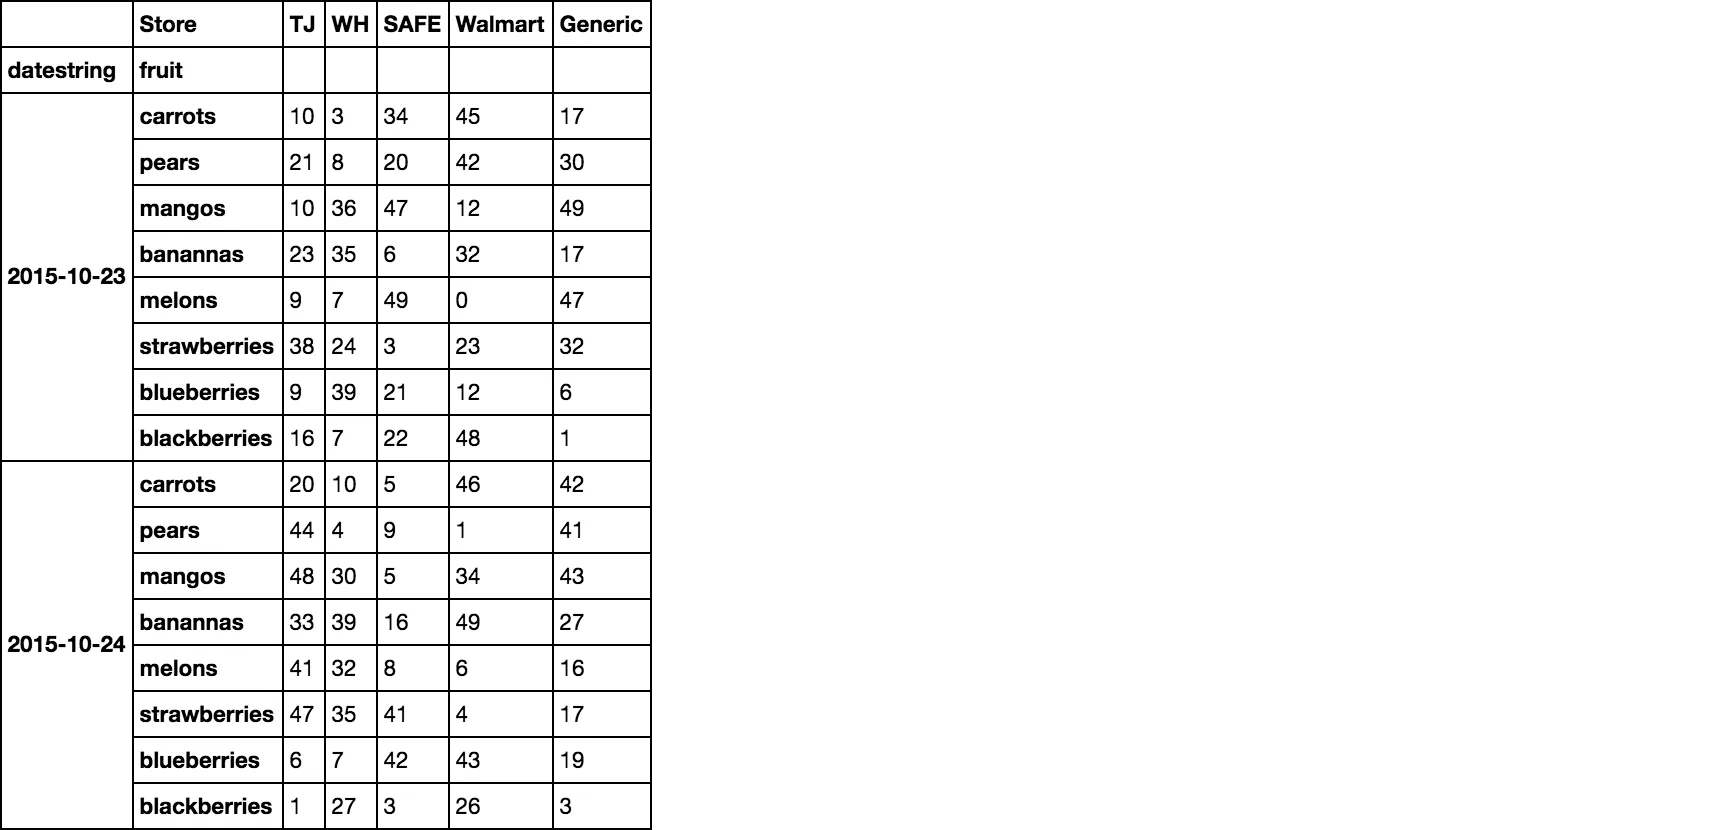
df.index.set_levels(pd.to_datetime(df.index.levels[0]), 0, inplace=True)
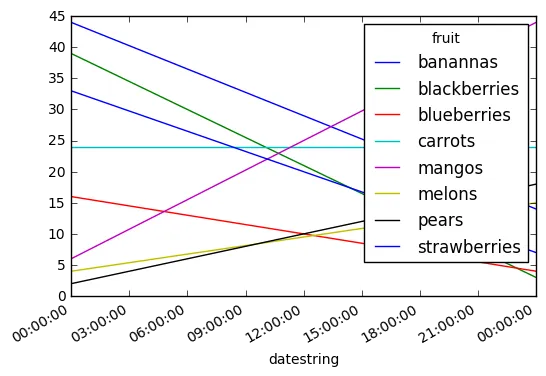
现在我们可以直观地绘制图表。
df.TJ.unstack(fill_value=0).plot()
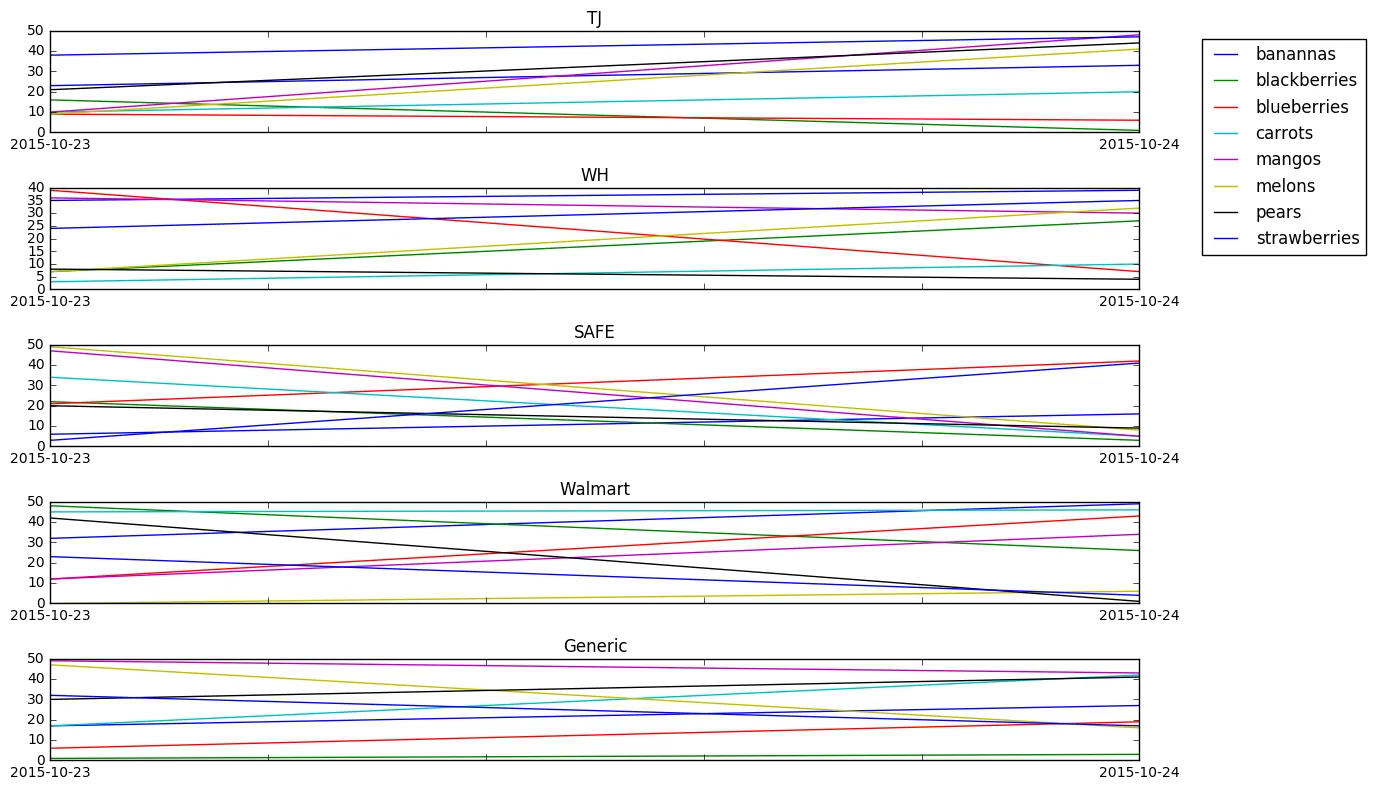
我们可以使用以下代码来绘制它们的图形:
fig, axes = plt.subplots(5, 1, figsize=(12, 8))

for i, (j, col) in enumerate(df.iteritems()):
    ax = axes[i]
    col = col.rename_axis([None, None])
    col.unstack(fill_value=0).plot(ax=ax, title=j, legend=False)

    if i == 0:
        ax.legend(bbox_to_anchor=(1.05, 1), loc='upper left', ncol=1)

fig.tight_layout()