使用自定义符号来绘制ggplot点图,更改图例符号以匹配。

3

我正在绘制一系列数据点,每个国家都需要特定的符号/形状来代表它们(它实际上不是国家,但真正的组别没有意义 - 我正在复制一个旧图,并希望保持符号的一致性)。有九个不同的国家要绘制。到目前为止,我找到的最简单方法是在实际数据框中编写我想要的符号,例如:

Point    y       x       Country
V      0.316   0.073     UK
P      0.284   0.053     USA
%      0.284   0.061     Germany
+      0.314   0.072     France     
|      0.268   0.075     Spain     
h      0.313   0.0758    Canada
#      0.121   0.0623    Australia
i      0.234   0.0765    India
C      0.213   0.059     Norway

然后像这样绘图:

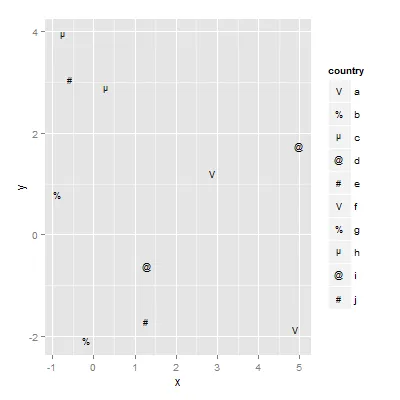
ggplot(data, aes(x, y, label = Point, colour = Point)) + geom_text() 

当涉及到图例时,这并不是特别好的:

enter image description here

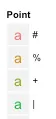
我该怎么做才能让点成为图例的符号,然后将国家作为图例的标签?

1个回答

4
aes()中的shape=country加入,并使用scale_shape_manual()选择符号。
x=rnorm(10,1,2)
y=rnorm(10,1,2)
country=letters[1:10]
data=cbind.data.frame(x,y,country)
require(ggplot2)
ggplot(data,aes(x,y,shape=country))+
  geom_point(size=6)+
  scale_shape_manual(values=c("V","%","µ","@","#","V","%","µ","@","#"))

enter image description here


网页内容由stack overflow 提供, 点击上面的
可以查看英文原文,
原文链接