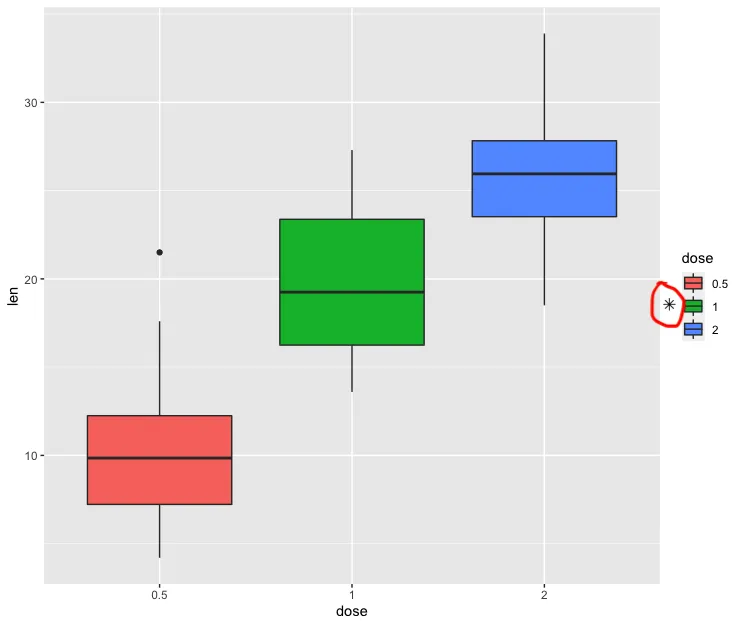
我想在 ggplot 图例中添加一个符号。下面的代码是 ggplot 的符号代码,我的问题是,如何绘制图片中圆圈中的 (*) 符号?
  library(ggplot2 )
ToothGrowth$dose <- as.factor(ToothGrowth$dose)
p <- ggplot(ToothGrowth, aes(x=dose, y=len, fill=dose)) +
  geom_boxplot()
p
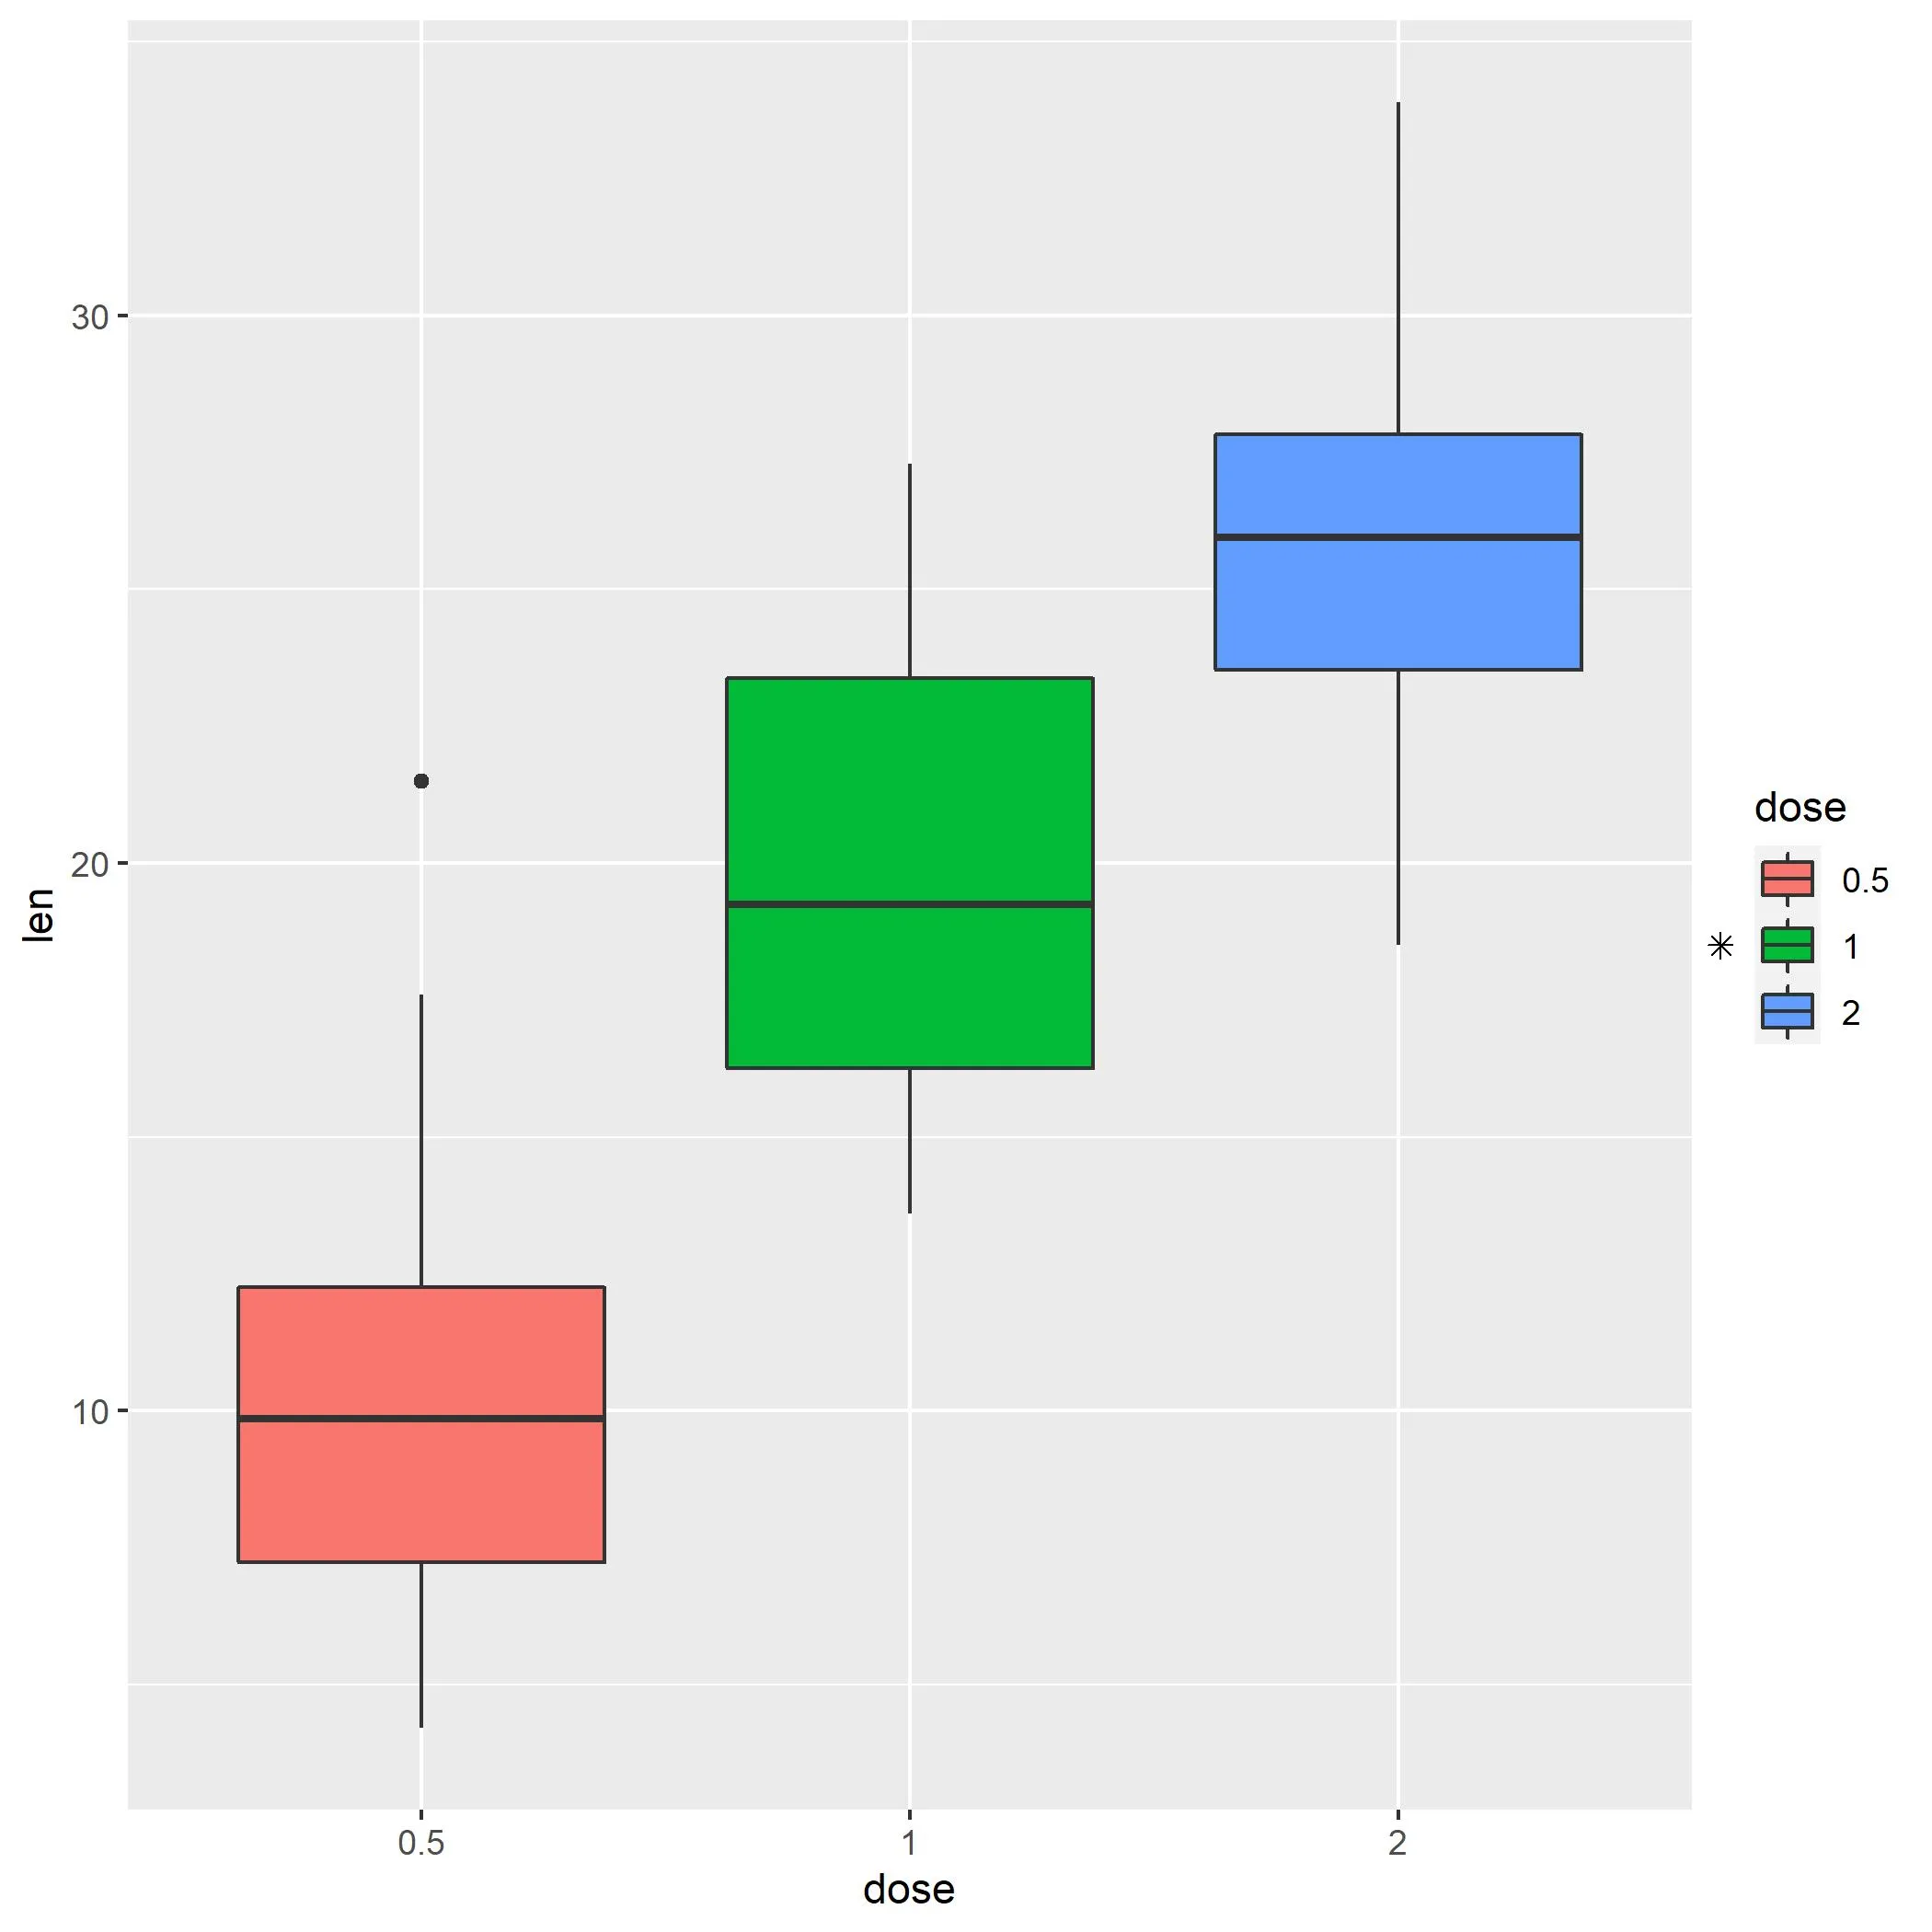
需要一些手动调整才能正确定位,但是你可以使用annotate和coord_cartesian来在绘图外部添加符号作为注释, 并设置clip = off. 该回答中提供了一些提示,可以参考此处。
ToothGrowth$dose <- as.factor(ToothGrowth$dose)

p <- ggplot(ToothGrowth, aes(x=dose, y=len, fill=dose)) +
  geom_boxplot() +
  annotate("point", x = 3.66, y = 18.5, shape = 8, size = 2) +
  coord_cartesian(xlim = c(1, 3), clip = "off")

ggsave('test.jpg', p)
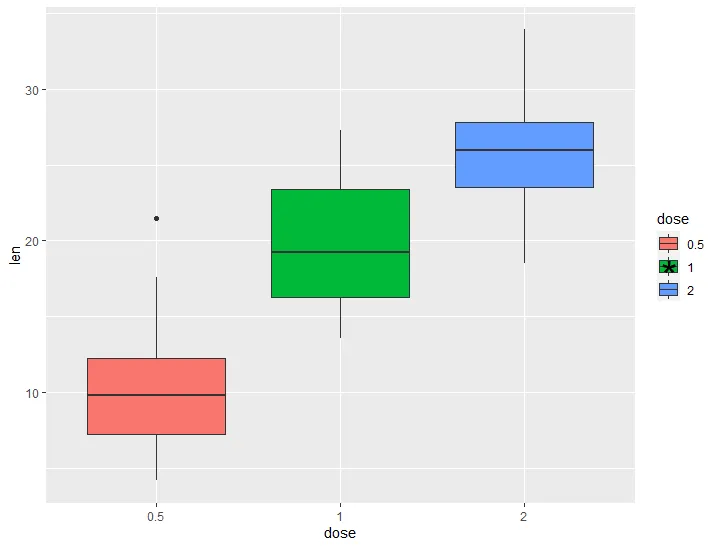
编辑:如果出现重叠,上面答案中的形状将被图例隐藏。使用标签是一个类似的解决方案,但可以允许符号绘制在图例之上。它仍然需要一些手动调整,但坐标是相对于图形而不是数据的(看起来像是一个优点)。
ToothGrowth$dose <- as.factor(ToothGrowth$dose)

p <- ggplot(ToothGrowth, aes(x=dose, y=len, fill=dose)) +
  geom_boxplot() +
  labs(tag = '*') +
  theme(plot.tag.position = c(.94, 0.5),
        plot.tag = element_text(size = 30))

ggsave('test.jpg', p)
1 * 将是处理此问题更健壮的方法。 - nniloc
1*或*1可能会更容易。这样可以吗?否则,除非你想进行 非常 深入的图形操作,否则我建议尝试将其导出为 PDF 或 SVG,并在 Illustrator 或 Inkscape 中修改。 - Ben Bolkergeom_*()中的key_glyph参数选择要在图例键中显示的字形。请参阅?draw_key以获取当前可用字形列表。key_glyph参数需要一个关键绘图函数。您需要编写自己的函数,基于draw_key_boxplot来获得所需内容。我从未这样做过。正如@BenBolker所说,这很棘手。 - Julian Neuer