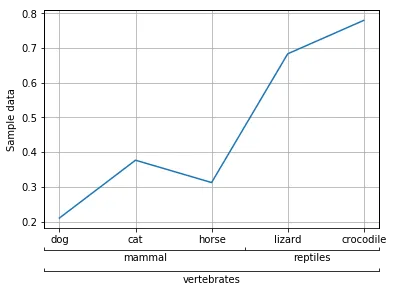
这是 @Vadim 的回答的稍微更新版本,因为我找到了一种不需要 SubplotHost 的方法来完成这个操作。这样,即使您没有创建子图(例如在使用 seaborn 的 figure-level 函数时),您也可以这样做。
import numpy as np
import matplotlib.pyplot as plt
import matplotlib.ticker as ticker
fig1, ax1 = plt.subplots(1)
x = np.arange(1,6)
y = np.random.random(len(x))
ax1.plot(x, y)
ax1.set_xticks(x)
ax1.set_xticklabels(['dog', 'cat', 'horse', 'lizard', 'crocodile'])
ax1.yaxis.set_label_text("Sample data")
ax2 = ax1.twiny()
ax2.spines["bottom"].set_position(("axes", -0.10))
ax2.tick_params('both', length=0, width=0, which='minor')
ax2.tick_params('both', direction='in', which='major')
ax2.xaxis.set_ticks_position("bottom")
ax2.xaxis.set_label_position("bottom")
ax2.set_xticks([0.0, 0.6, 1.0])
ax2.xaxis.set_major_formatter(ticker.NullFormatter())
ax2.xaxis.set_minor_locator(ticker.FixedLocator([0.3, 0.8]))
ax2.xaxis.set_minor_formatter(ticker.FixedFormatter(['mammal', 'reptiles']))
ax3 = ax1.twiny()
ax3.spines["bottom"].set_position(("axes", -0.20))
ax3.tick_params('both', length=0, width=0, which='minor')
ax3.tick_params('both', direction='in', which='major')
ax3.xaxis.set_ticks_position("bottom")
ax3.xaxis.set_label_position("bottom")
ax3.set_xticks([0.0, 1.0])
ax3.xaxis.set_major_formatter(ticker.NullFormatter())
ax3.xaxis.set_minor_locator(ticker.FixedLocator([0.5]))
ax3.xaxis.set_minor_formatter(ticker.FixedFormatter(['vertebrates']))
ax1.grid(True)
plt.show()