如何使用Matlab旋转一条直线?

5
假设我有一张图像 I 和一条线段 h1。使用 Matlab,我可以如下绘制该线段:
h1 = plot( [l1 l1],[20 100], 'r');

现在我想以45度的角度旋转图像I。因此,我使用了imrotate,代码如下:

IR = imrotate(I,45);

现在,我想要用Matlab旋转这条线,该怎么做呢?

我找到了rotate函数。我正在尝试使用它,但似乎不起作用!

rotate(h1,[1 1],45);
2个回答

5
为了旋转线条,您可以使用旋转矩阵明确地“旋转”定义线条的点: enter image description here 
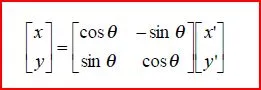
旋转中心由添加到线条点的坐标的“偏移量”定义:
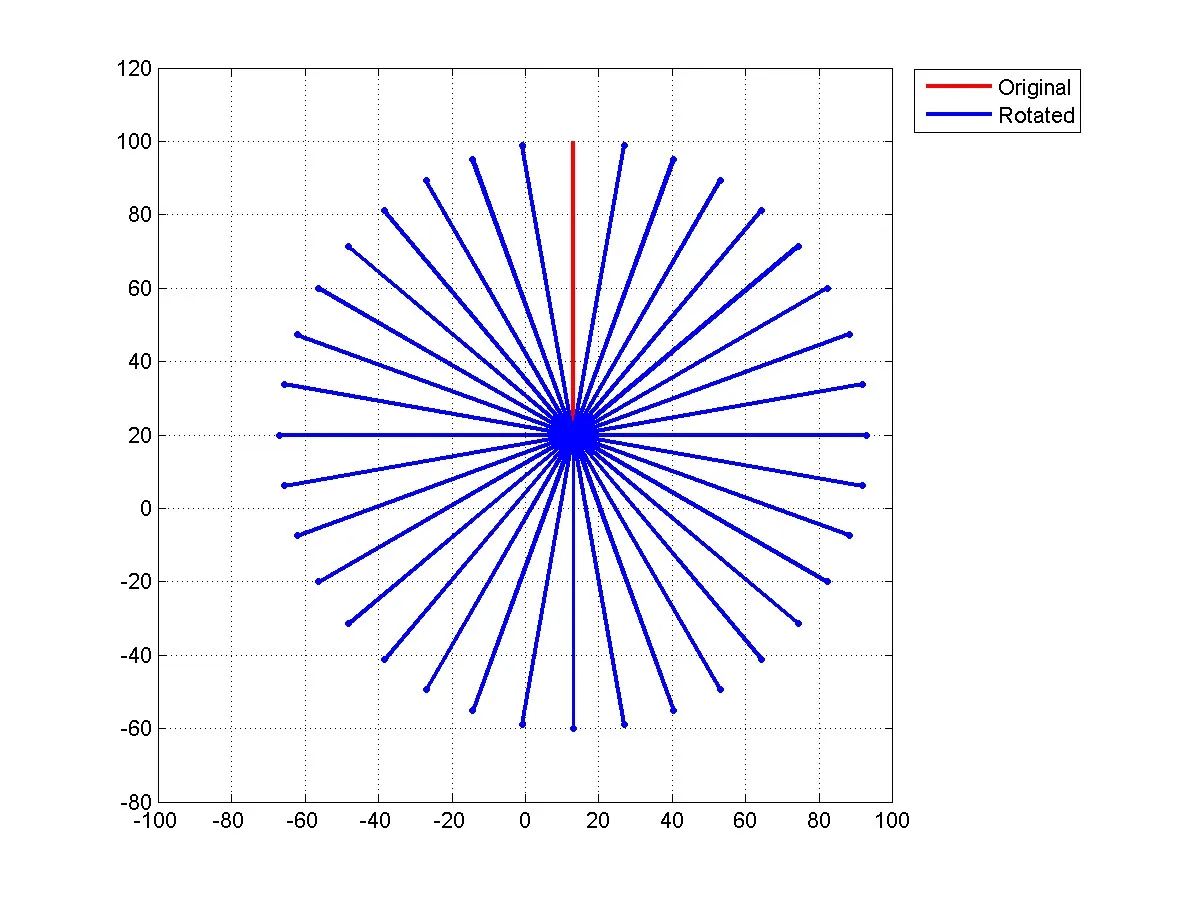
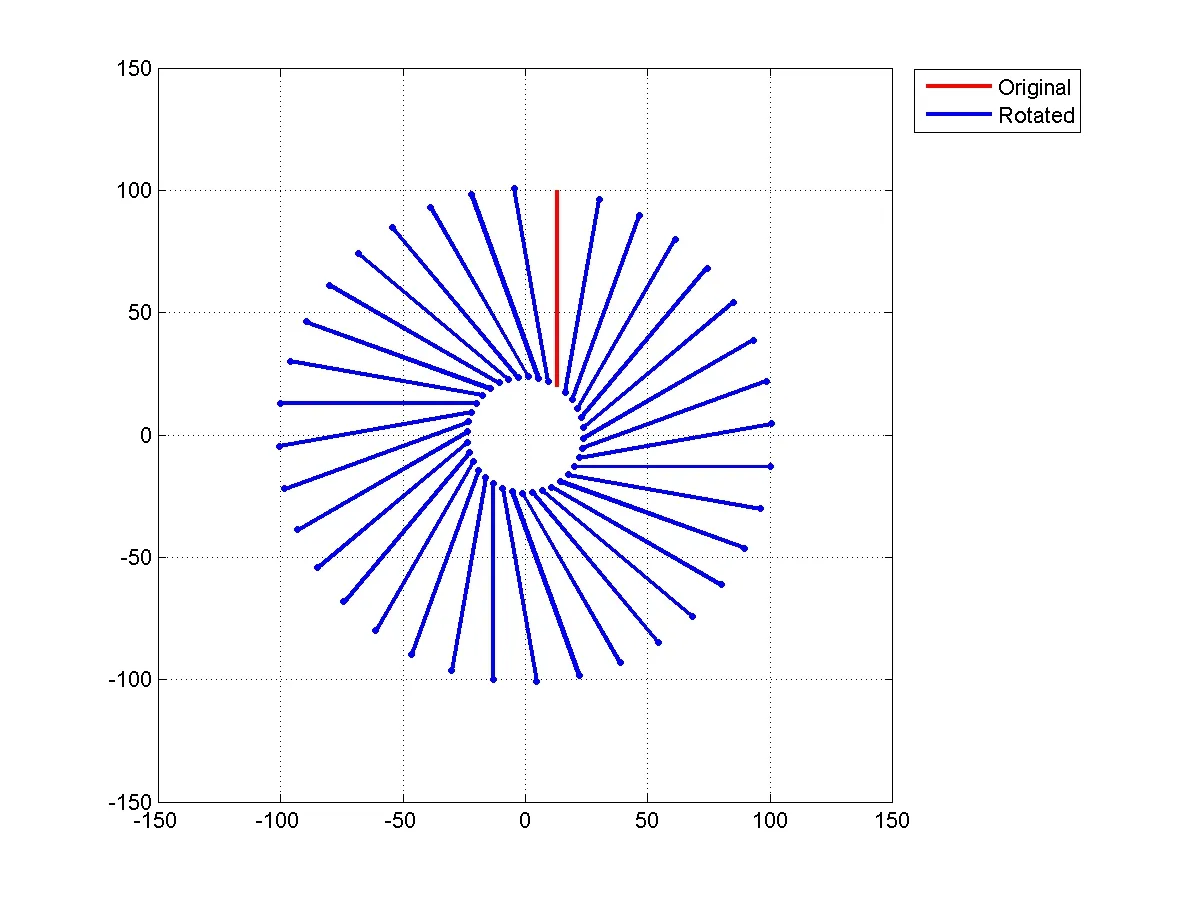
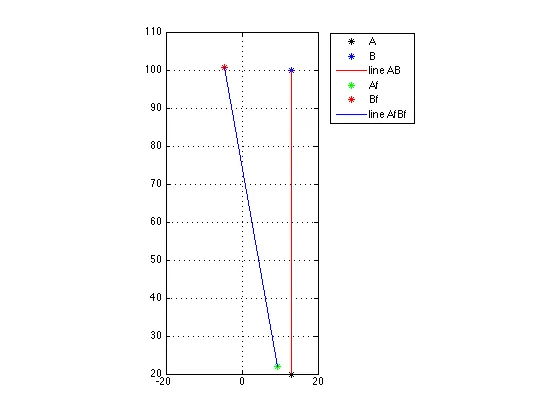
在以下示例中,线条围绕以下位置旋转:
- 线条的下端点(偏移量=线条下端点的坐标) - 原点(0,0)(偏移量= 0) - 原始线的一个点(偏移量=线条一点的坐标) 更新后的代码
% Definition of the L1 parameter
L1=13;
% Definition of the points A and B
A=[L1,20]
B=[L1,100]
x=[A(1) B(1)];
y=[A(2) B(2)];
% Definition of the offset
x_offset=[x(1) 0 x(1)];
y_offset=[y(1) 0 50];
for k=1:3
   figure
   % Plot of the original line
   plot(x,y,'r','linewidth',2)
   grid on
   hold on
   for a=10:10:350
      % Definitin of the rotation angle
      % a=45;
      t=a*pi/180;
      % Definition of the rotation matrix
      mx=[ ...
         cos(t) -sin(t)
         sin(t) cos(t)
         ];
      % Traslation and rotation of the points A and B
      x1_y1=mx*[x - x_offset(k);y - y_offset(k)]
      x1=x1_y1(1,:);
      y1=x1_y1(2,:);
      % Plot of the rotated line
      ph=plot(x1+x_offset(k),y1+y_offset(k),'b','linewidth',2)
      daspect([1 1 1])
      % xlim([-100 30])
      % ylim([-80 120])
      plot(x1+x_offset(k),y1+y_offset(k),'o','markeredgecolor','b', ...
         'markersize',3,'markerfacecolor','b')
      pause(.05)
      % delete(ph)
   end
   legend('Original','Rotated',-1)
end

使用函数delete删除前一条线,并绘制新的线。

在MatLab 2015中存在函数rotx

希望这可以帮助你。

围绕点A旋转 enter image description here

围绕原点(0,0)旋转

enter image description here

围绕线段的某一点旋转 enter image description here


xy 的维度是多少?你的意思是 L1 = m * L,其中 L(x,y),而 L1=(x1,y1) 吗? - user813853
我已经更新了答案中的代码;x和y是原始坐标的数组。为了将直线绕其中一个顶点旋转,首先应该将直线“移动”到原点(0;0),然后应用旋转矩阵,最后再将直线移回去。 - il_raffa
它不是11,而是l1 - user813853
如果我绘制 plot( [l1 l1],[20 100], 'r'),那意味着我有两个点 A(l1,20)B(l1,100)。我还是不太理解你的代码,但我正在努力学习中... - user813853
1
你好@OSryx,在你的问题中你没有指定旋转直线的参考点;当我编写答案时我选择直线的下端点作为旋转中心点。然而,通过offset参数可以让直线围绕任意点旋转: 我根据这个做了代码更新,引入一个循环,允许在3个不同的点(下端点,原点和直线上的某个点)旋转直线。结果显示在图片中。 - il_raffa
显示剩余3条评论

1

这是一个围绕原点(0,0)旋转两个点并在图形上显示结果的函数。

更新

function [Af,Bf] = rotateTwoPoints (A,B,t)
% Definition of the rotation matrix (rotation around origin (0,0) )
R=[ ...
   cosd(t) -sind(t)
   sind(t) cosd(t)
   ];

% rotation of the points A and B
Af = R*A;
Bf = R*B;

% Plot of the original line
plot(A(1),A(2),'k*', B(1),B(2),'b*');
line([A(1) B(1)],[A(2) B(2)], 'Color','r');

grid on
hold on

% Plot of the rotated line
plot(Af(1),Af(2),'g*', Bf(1),Bf(2),'r*');
line([Af(1) Bf(1)],[Af(2) Bf(2)], 'Color','b');
legend('A','B','line AB','Af','Bf','line AfBf','Location','northeastoutside');
daspect([1 1 1])

对于A(13,20)、B(13,100)的图像旋转,且t = 10°

[Af,Bf] = rotateTwoPoints(A,B,10)

enter image description here


网页内容由stack overflow 提供, 点击上面的
可以查看英文原文,
原文链接