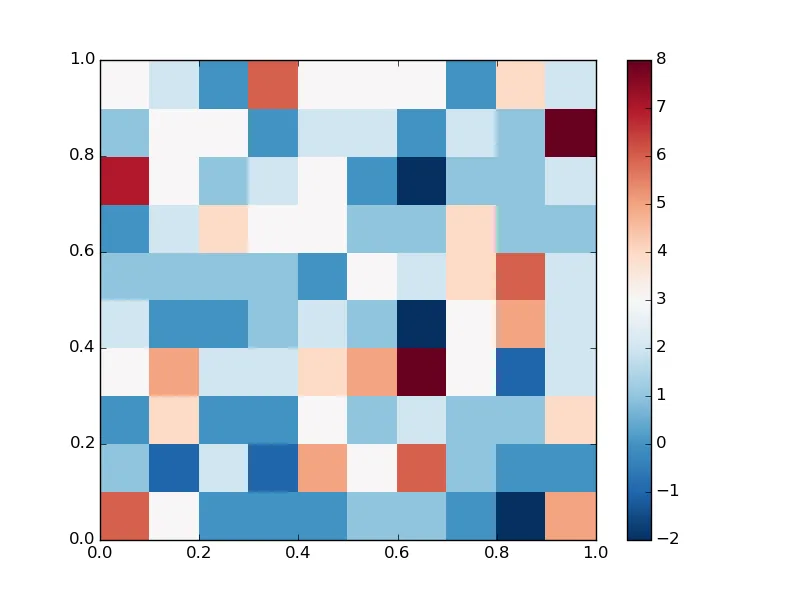
我想绘制一个包含正数和负数的2D直方图。我有以下使用pcolormesh的代码,但我无法指定颜色级别以将白色对应为零(即,我希望我的色条围绕零对称)。我也尝试过imshow。
我知道你可以在plt.contour和plt.contourf中指定颜色级别,但我找不到一种使用块绘制2D直方图的方法。
任何建议都将不胜感激。
我知道你可以在plt.contour和plt.contourf中指定颜色级别,但我找不到一种使用块绘制2D直方图的方法。
任何建议都将不胜感激。
import numpy as np
import matplotlib.pyplot as plt
from matplotlib import cm as CM

fig = plt.figure()

# create an example histogram which is asymmetrical around zero
x = np.random.rand(400)
y = np.random.rand(400)
Z, xedges, yedges = np.histogram2d(x, y, bins=10)
Z = Z - 2.

plt.pcolormesh(xedges, yedges, Z, cmap=CM.RdBu_r)

plt.colorbar()
plt.savefig('test.png')