我正在创建直方图
pylab.hist(data,weights,histtype='step',normed=False,bins=150,cumulative=True)
获取(还有其他的图表,现在不相关)紫色线
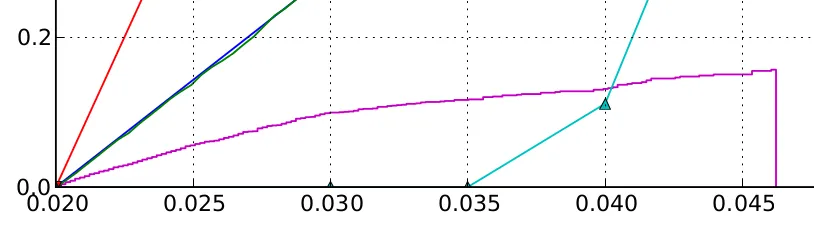
为什么直方图在末尾又降到零了?累积函数通常应是非递减的。是否存在解决此问题的方法,无论是漏洞还是功能?
我正在创建直方图
pylab.hist(data,weights,histtype='step',normed=False,bins=150,cumulative=True)
获取(还有其他的图表,现在不相关)紫色线
为什么直方图在末尾又降到零了?累积函数通常应是非递减的。是否存在解决此问题的方法,无论是漏洞还是功能?
import numpy as np
import matplotlib.pyplot as plt
data = np.random.randn(5000)
counts, bins = np.histogram(data, bins=20)
cdf = np.cumsum(counts)/np.sum(counts)
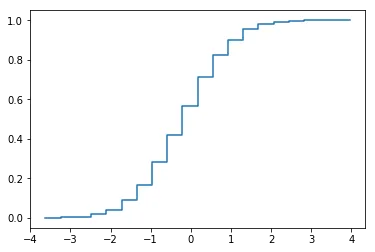
plt.plot(
np.vstack((bins, np.roll(bins, -1))).T.flatten()[:-2],
np.vstack((cdf, cdf)).T.flatten()
)
plt.show()
这是默认行为。可以将其视为直方图的条形图轮廓。至于快速解决方法,我不知道有什么。一个解决方案是自己计算直方图:python histogram one-liner
解决方案(hack):
# histtype=step returns a single patch, open polygon
n,bins,patches=pylab.hist(data, weights, histtype='step', cumulative=True)
# just delete the last point
patches[0].set_xy(patches[0].get_xy()[:-1])
这篇回答是由OP Zer0 在CC BY-SA 3.0下发布的,并作为编辑问题累积直方图在y = 0处有最后一个点。